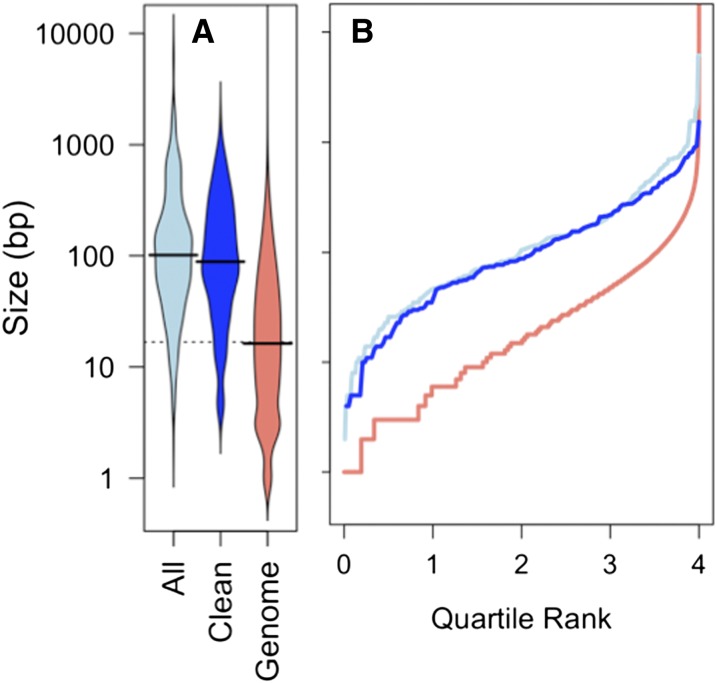
Figure 8.
Breakpoint interval lengths are longer than genome average. (A) Beanplot of sizes of breakpoint intervals (distance between outermost donor-specific SNVs and innermost recipient-specific SNVs): “All” includes all breakpoint intervals; “Clean” includes only unique breakpoints of unselected donor segments unaffected by SVs; and “Genome” includes all intervariant spacings (35,931 total). Black lines show the medians; width of bean is proportional to the density of values with that spacing. (B) Plot of the same data, where the x-axis is the cumulative proportion of the data with interval size less than the value indicated on the y-axis.

