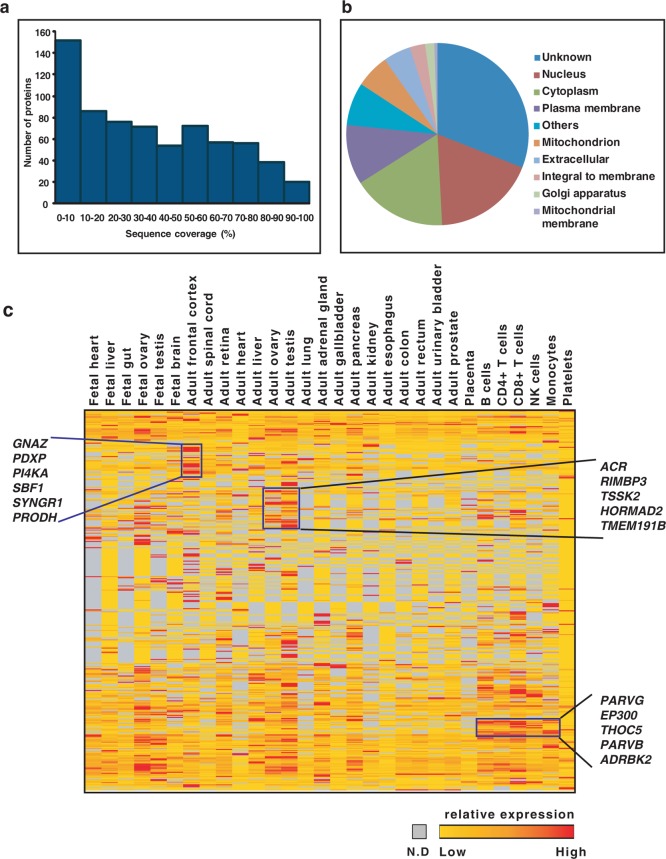
Figure 1.
(a) Sequence coverage of proteins encoded by chromosome 22. (b) Distribution of identified chromosome-22-encoded proteins based on subcellular localization. (c) Tissue-wise distribution of protein coding genes encoded by chromosome 22. Distribution of proteins identified from 30 histologically normal tissues and cell lines based on their spectral abundance. The color schema is based on the spectral counts: red blocks represent proteins with relatively higher expression, orange depicts moderate expression, and yellow represents relatively low expression. Proteins not detected in a given tissue are represented in gray.

