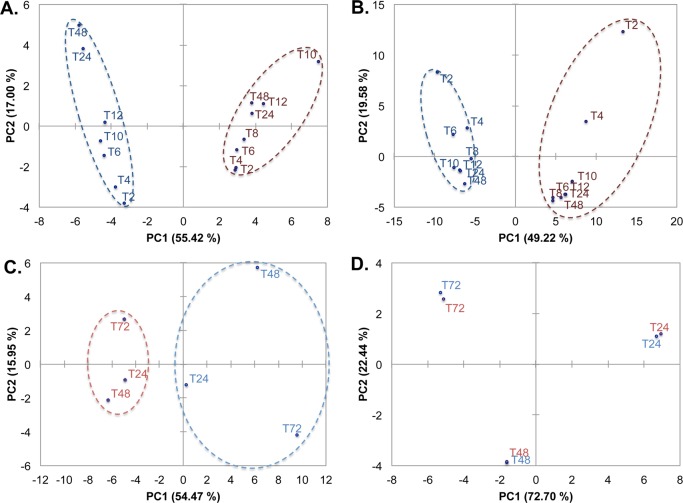
Figure 3.
Principal component analysis (PCA) comparison of two S. aureus strains. 2D PCA scores plots indicate statistically significant sample separations along the first dimension (PC1) between the metabolite profiles of S. aureus 10943 (blue lines) and S. aureus 6538 (red lines) for both intracellular and extracellular metabolites of planktonic cultures (panels A and B, respectively) and biofilm extracellular metabolites (panel C, as detected by 1D 1H NMR). In contrast, metabolite profiles for biofilm intracellular metabolites cluster nearly identically (panel D). Dark colors (red and blue) indicate planktonic cultures, and light colors (red and blue) indicate biofilm cultures. Numbers correspond to hours postinoculation for planktonic cultures (e.g., T2, T4, T6, etc.) and hours past reaching linear growth in biofilms (e.g., T24, T48, T72).

