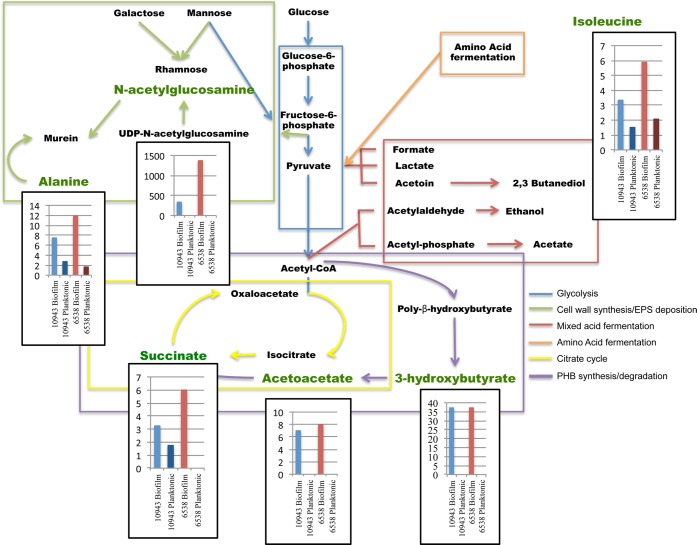
Figure 6.
Schematic representation of central metabolism and secondary metabolic activity in S. aureus characteristic of the biofilm phenotype. Bar charts represent fold changes in metabolite concentrations for biofilm and stationary planktonic samples, respectively, normalized to the metabolite concentrations in each respective exponential planktonic culture for select intracellular and extracellular biofilm metabolites that contribute to statistical separation of the biofilm phenotype from the planktonic phenotype irrespective of strain. S. aureus 10943 is indicated by blue bars and S. aureus 6538 is indicated by red bars. Dark bars indicate planktonic samples and light bars indicate biofilm samples. Data shown are representative samples from duplicate experiments.

