Figure 2.
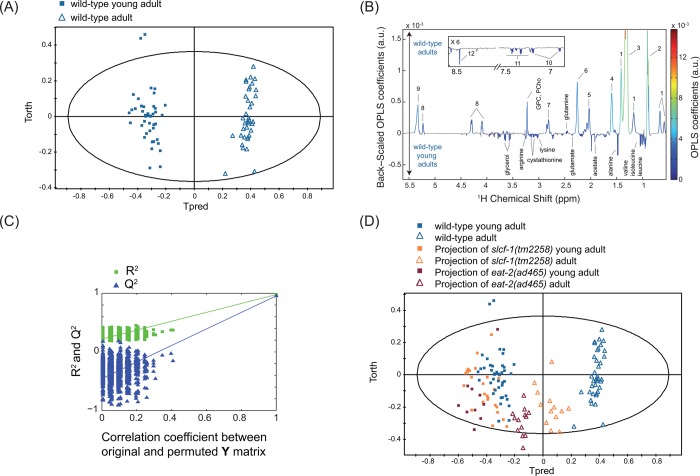
Metabolic signature of aging in wild-type C. elegans worms. OPLS model discriminating wild-type young adults and wild-type adults (1 predictive component and 3 orthogonal components; R2X = 0.846, R2Y = 0.978, Q2 = 0.956) from Pareto-scaled data set: (A) score plot; (B) loadings plot resulting from the SRV analysis, showing back-scaled OPLS coefficients values, colored from the original OPLS coefficients if variables were found statistically significant after a multiple testing univariate procedure (Benjaminin-Yekutieli correction); and (C) model validation resulting from 1000 permutations, demonstrating the model robustness, because model R2 and Q2 values were significantly higher than random model ones. (D) Score plot of the projections of slcf-1(tm2258) and eat-2(ad465) adults and young adults in the OPLS model (A), discriminating wild-type adults, and young adults. Key: 1, cyclic fatty acids; 2, lipids (CH3); 3, lipids ((CH2)n); 4, lipids (CH2CH2CO); 5, unsaturated lipids (CH2CH=CH); 6, lipids (CH2CO); 7, unsaturated lipids (CH=CHCH2CH=CH); 8, glyceryl of lipids; 9, unsaturated lipids (CH=CH); 10, tyrosine; 11, phenylalanine; 12, formate; PCho, phosphocholine; GPC, glycerophosphocholine.

