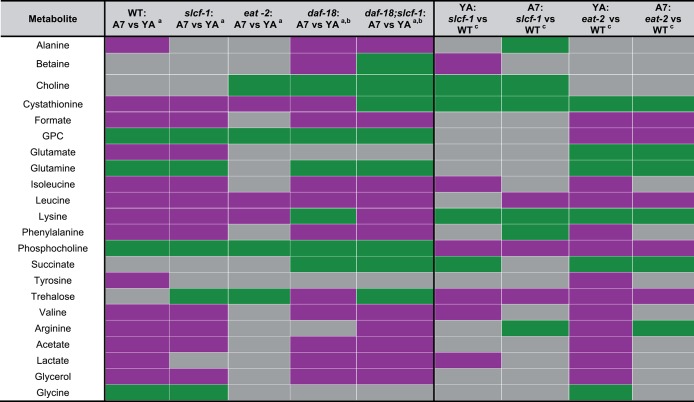
Figure 3.
Metabolite variations with age in WT, slcf-1(tm2258), eat-2(ad465), daf-18(e1375) mutants, and daf-18(e1375);slcf-1(tm2258) double mutants and between WT and long-lived mutants slcf-1(tm2258) or eat-2(ad465) in young adults and 7-day-old adults. a = Increase (green) or decrease (purple) in metabolite concentrations with age. b = Acetate, lactate, glycerol, and glycine variations are not reliable due to signal overlaps. c = Increase (green) and decrease (purple) in metabolite concentrations in long-lived mutant (slcf-1 or eat-2) by comparison to WT. Nonsignificant metabolite variations are left in gray; YA, young adult; A7, adult.

