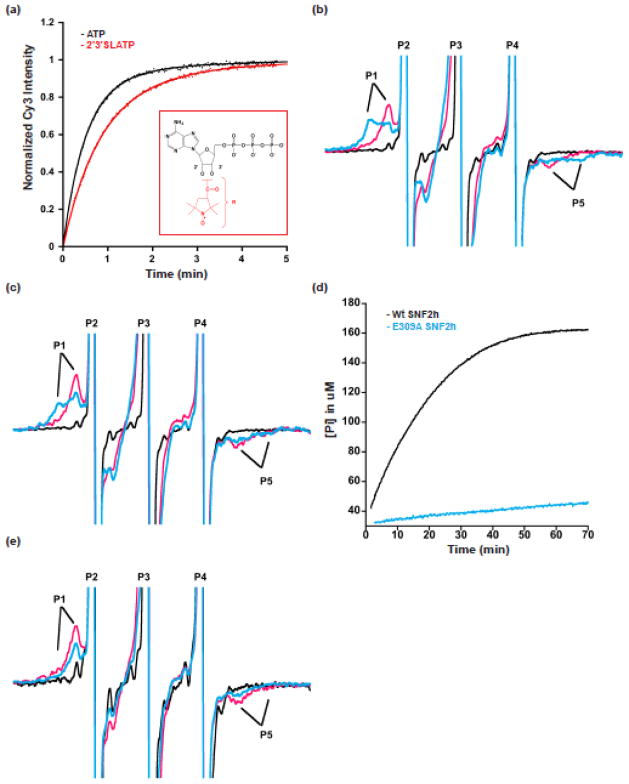
Figure 2. Spin-labeled ATP analogues reveal conformational changes in the ATP-binding pocket of SNF2h.
a. 2′3′SLATP supports SNF2h nucleosome remodeling. Remodeling kinetics of N+80 nucleosomes (5 nM) with 150 nM of SNF2h, 1mM MgCl2 and 0.5mM of ATP or 2′3′SLATP (kobs for n=3 is 2.0±0.06 min−1 and 1.2±0.22 min−1, respectively for ATP and 2′3′SLATP). Representative remodeling traces are shown. Inset: 2′3′SLATP analog (nitroxyl-radical spin probe shown in red). b. Representative EPR spectra of 2′3′SLADP and 2′3′SLADP-BeFx with SNF2h and N+60 nucleosomes. The spectrum of 2′3′SLADP alone (without SNF2h and nucleosomes) is shown in black. The presence of nucleosomes and SNF2h (pink spectrum) produces a bound peak (P1) in the 2′3′SLADP spectrum with a high-field to low-field (P1–P5) splitting of 4.8mT (118.8° cone angle). When the analog 2′3′SLADP•BeFx is used with nucleosomes and SNF2h (blue spectrum) this produces a second, more immobilized peak (P1, blue) with a P1–P5 splitting of 6.2mT (68° cone angle). Spectral peaks are truncated to enhance resolution of bound probe. c. Representative spectra of 2′3′SLADP (pink) and 2′3′SLADP•BeFx (blue) bound to SNF2h in the presence saturating concentrations of a 60 base pair DNA fragment. The black spectrum (2′3′SLADP alone) is from panel b for comparison. d. Comparison of the ATPase rates of wildtype enzyme (black) and the E309A mutant (blue) in the presence of N+60 nucleosomes. The curves level off due to depletion of MESG, the Enzchek assay detection reagent (See Methods). e. Representative spectra of 2′3′SLADP (pink) and 2′3′SLADP•BeFx (blue) bound to the E309A SNF2h mutant in the presence of N+60 nucleosomes.

