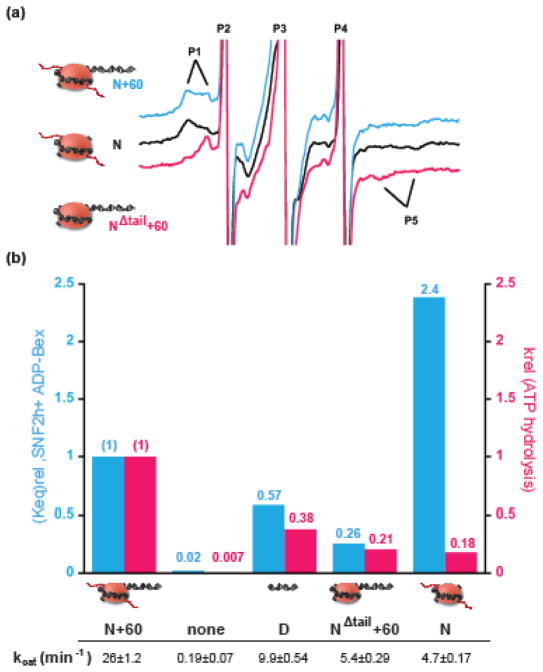
Figure 3. Effects of substrate cues on the immobile/mobile probe equilibrium and on ATP hydrolysis.
a. Representative spectra of 2′3′SLADP•BeFx bound to SNF2h in the presence of different types of nucleosomes. The equilibrium between the immobile and mobile populations of bound probe shifts in favor of the more immobile conformation when flanking DNA is removed (N+60, blue spectrum vs. N, black spectrum). In contrast, the equilibrium shifts towards the more mobile conformation when the H4 tail is removed (N+60, blue spectrum vs. NΔtail+60, pink spectrum). b. Top panel: comparison of effects on ATP hydrolysis and Keq. Blue bars: Keq values relative to the N+60 substrate. Keq is obtained as defined in Table 1 in the presence of 2′3′SLADP•BeFx. Pink bars: kcat values for ATP hydrolysis relative to the N+60 substrate. Bottom panel: The values of kcat for ATP hydrolysis under multiple-turnover conditions.

