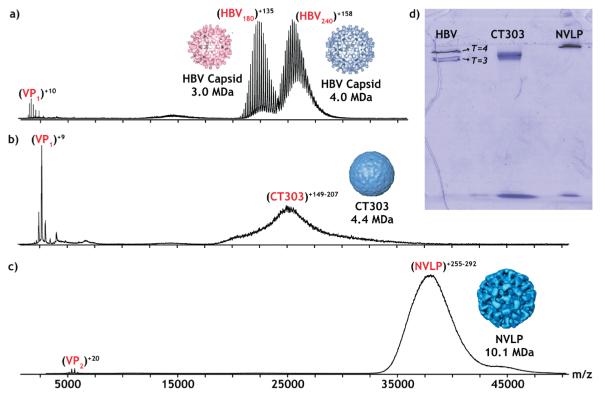
Figure 1.
Representative native nanoelectrospray mass spectra for (a) HBV (0.04 μM capsid concentration) in 200 mM ammonium acetate buffer (pH 6.8), serving as comparison for the other spectra, (b) CT303 (0.1 μM capsid concentration) in 250 mM ammonium acetate buffer (pH 7), and (c) NVLPs (0.2 μM capsid concentration) in 250 mM ammonium acetate buffer (pH 7). (d) Native gel: for each capsid, 25 μg was loaded onto a 4% (w/v) gel where they were analyzed by BN-PAGE to further confirm their integrity. The bands at the bottom of the gel represent monomers/dimers.

