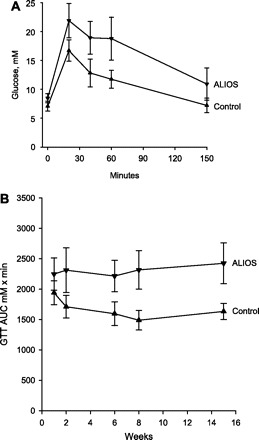
Fig. 8.

A: glucose tolerance test (GTT) after 15 wk of ALIOS conditions. Mice received 1 mg/kg glucose by intraperitoneal injection at time 0. Blood glucose was greater in ALIOS mice compared with control mice at all time points, including fasting glucose levels (P < 0.01). B: GTTs were performed at multiple time points, and the areas under the curves (AUCs) are shown as a function of duration of treatment. Reduced glucose tolerance was noted within 2 wk of treatment, and impaired fasting glucose was evident by 6 wk. GTT AUC was greater in ALIOS mice compared with control mice at all time points measured (P < 0.01). Error bars denote SD; n = 10 mice/group.
