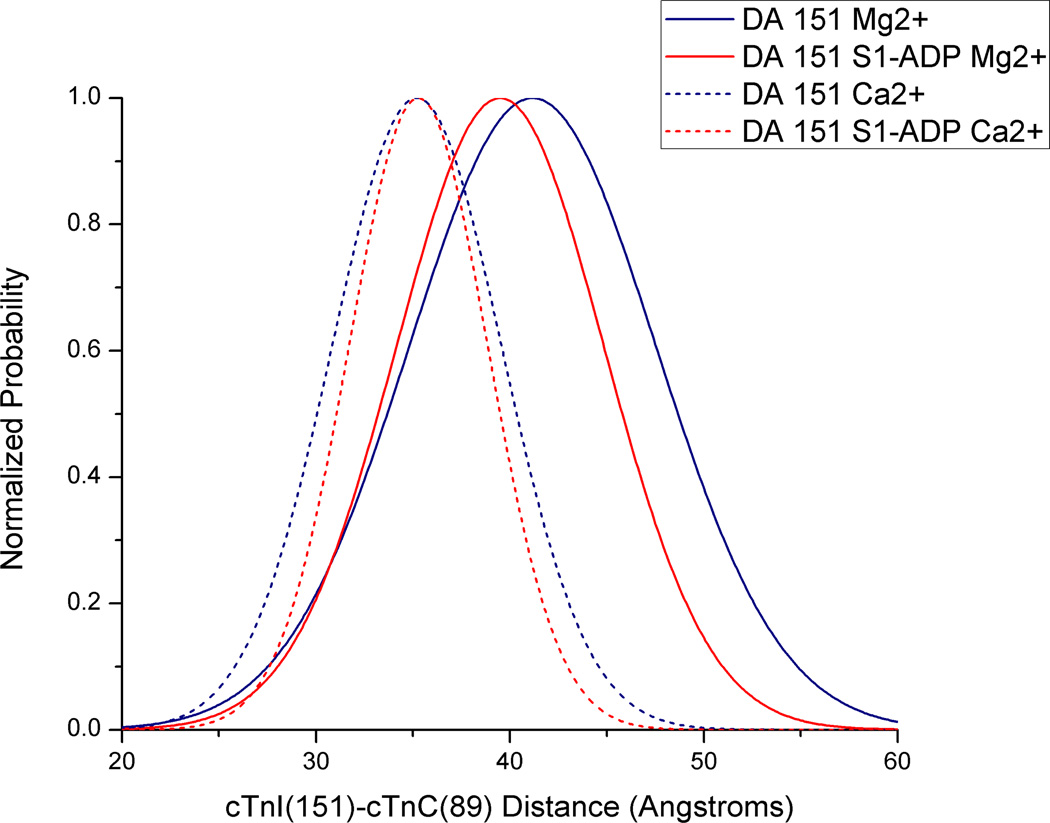
Figure 4.
Representative distance distributions derived by GlobalCurve fitting of fluoresence intensity decay data. Traces are for cTnI(S151CAEDANS)-cTnC(S89CDDPM)-cTnT(WT) samples in low Ca2+ without S1-ADP (solid blue trace), in low Ca2+ with S1-ADP present (solid red trace) and both with and without S1-ADP present under saturating levels of Ca2+ (solid red and blue traces respectively).

