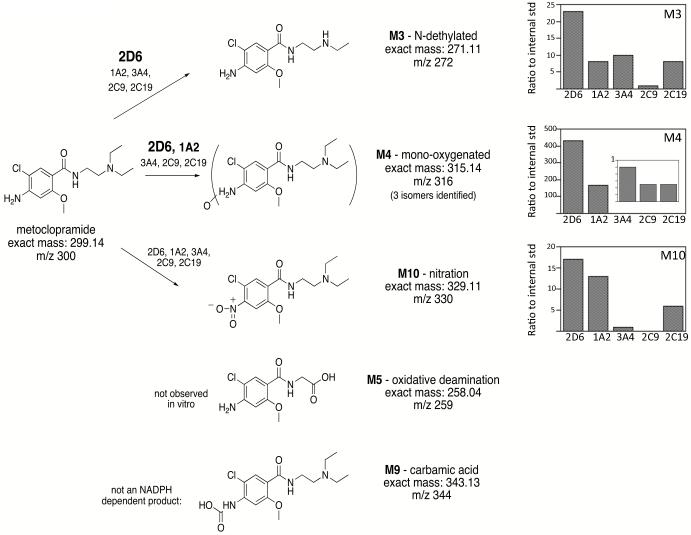
Figure 2.
Structure of metoclopramide and observed metabolites. Metabolite mass to charge values (m/z) for each metabolite are indicated (M+1). Metabolite labels are consistent with Argikar et al. (Argikar et al., 2010). The ratio of product formation as compared to an internal standard for indicated metabolites by each CYP is shown in the bar graphs. For M4, levels of metabolite formed by 3A4, 2C9, and 2C19 are shown as an inset. Caffeine was used as an internal standard for quantification as indicated in the Methods.

