
Figure 1.
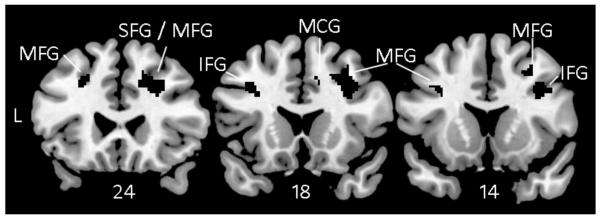
Voxel-based morphometry showing brain regions where atrophy correlated with lower scores on the Executive Composite consistently across all three analyses: Full sample (Table 5), No bvFTD (Table 6), and No PSP (Table 7). These results are not specific to any one diagnostic group. All results were thresholded voxelwise at p<.001 and corrected for multiple comparisons using permutation analysis with p<.05.