Figure 1.
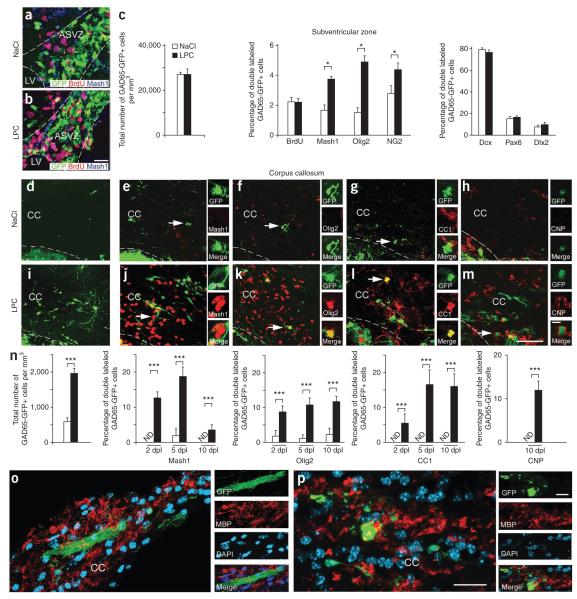
Demyelination increases GAD65-GFP–positive cells expressing glial lineage markers in the SVZ and corpus callosum. (a,b) GAD65-GFP–positive cells in the anterior subventricular zone (ASVZ) immunolabeled with antibodies to BrdU and Mash1 after NaCl (a) or LPC (b) injection at 5 dpl. Dotted lines bound ASVZ and lateral ventricle (LV). Scale bar represents 50 μm. (c) Total number of GAD65-GFP–positive cells does not change after LPC injections (n = 8 brains). Percentages of double-labeled GAD65-GFP–positive cells stained with antibodies to BrdU, Mash1, Olig2, NG2, Dcx, Pax6 and Dlx2 after LPC injections (n = 4 brains, *P < 0.05, t test). (d–m) Images of GAD65-GFP–positive cells in NaCl-injected (d–h) and LPC-injected (i–m) corpus callosum (CC) at 10 dpl. Cells were colabeled with antibodies to Mash1 (e,j), Olig2 (f,k), CC1 (g,l) or CNP (h,m). Dotted lines bound corpus callosum. Insets magnify cells indicated by arrows. Scale bar represents 50 μm. (n) Density of GAD65-GFP–positive cells in LPC- and NaCl-injected corpus callosum. Shown are the percentages of GAD65-GFP–positive and Mash1-positive, GAD65-GFP–positive and Olig2-positive, GAD65-GFP–positive and CC1-positive, and GAD65-GFP–positive and CNP-positive cells in LPC- and in NaCl-injected corpus callosum. ND, not detectable. Bar graphs represent means ± s.e.m. (n = 4–8 brains, ***P < 0.02, t test). (o,p) Images of GAD65-GFP–positive cells in LPC-injected corpus callosum at 14 dpl. GAD65-GFP–positive, MBP-positive oligodendrocytes were detected only in LPC-injected corpus callosum. Scale bars represent 50 μm.

