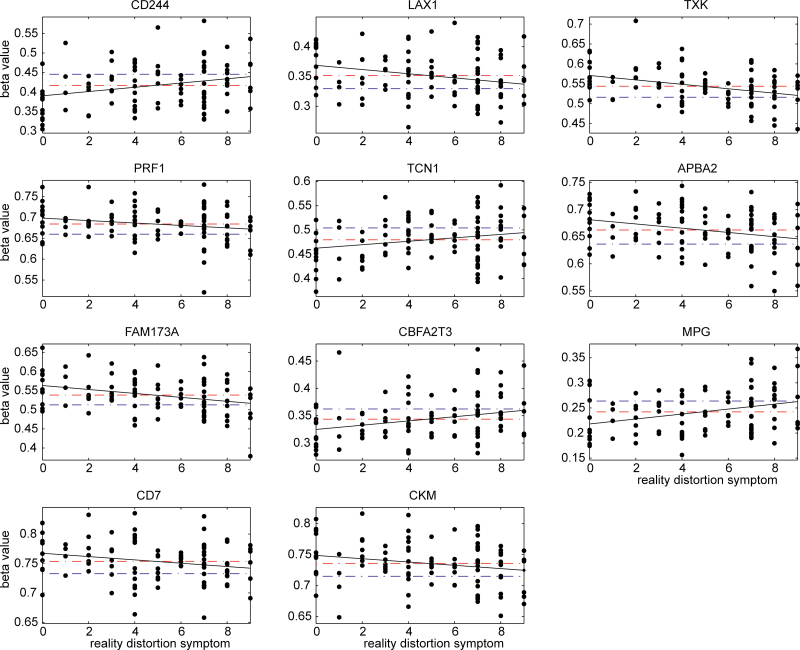
Fig. 1.
Methylation beta values of 11 C-phosphate-G (CpG) sites in schizophrenia (SZ) patients sorted by their reality distortion symptom scores; x axis plots reality distortion symptoms and y axis plots the measured beta values. Red dashed lines are the mean beta values of patients, while blue dashed lines are the mean beta values of healthy controls. The black line presents the slope between reality distortion symptom score and methylation beta value in patients.

