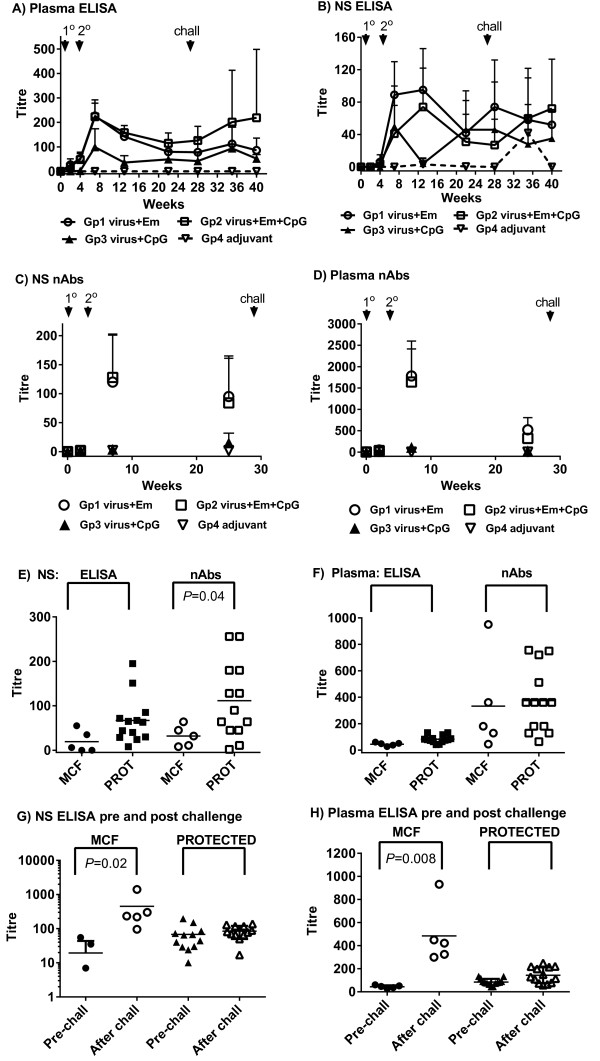
Figure 2.

Virus-specific antibody responses. (A, B) Virus-specific antibody titres in each of the 4 groups of cattle detected by ELISA. Group mean titres and standard deviation of the mean (SD, bars) are shown for each time point. Arrows show timing of primary (1°) and boost (2°) immunisations and virus challenge on week 27 (chall). (A) Blood plasma antibody; (B) antibody in nasal secretions (NS). (C, D) Virus neutralising antibody titres in each of the 4 groups of cattle. These were performed on samples prior to immunisation, at week 7 (3 weeks after booster immunisation) and on week 26, 1 week prior to virus challenge. Group mean titres and SD are shown for each time point; (C) Neutralising antibody titres in nasal secretions; (D) Neutralising antibody titres in blood plasma; (E, F) Comparison of total virus-specific antibody titres and virus-neutralising antibody titres in group 1 and 2 at week 26, just prior to virus challenge, in cattle that subsequently developed MCF or were protected (PROT); (E) Comparison in nasal secretions; (F) Comparison in blood plasma. P values for any significant comparisons are shown in the figures. (G, H) Comparison of total virus-specific antibody titres on week 26, just prior to virus challenge (pre-chall) and after challenge (taking the highest titre of the various time points after challenge) in animals that developed clinical MCF compared to those that were protected (PROT). (G) Nasal secretion antibody comparison. (H) Blood plasma antibody comparison. P values for any significant comparisons are shown in the figures.
