
Figure 6.
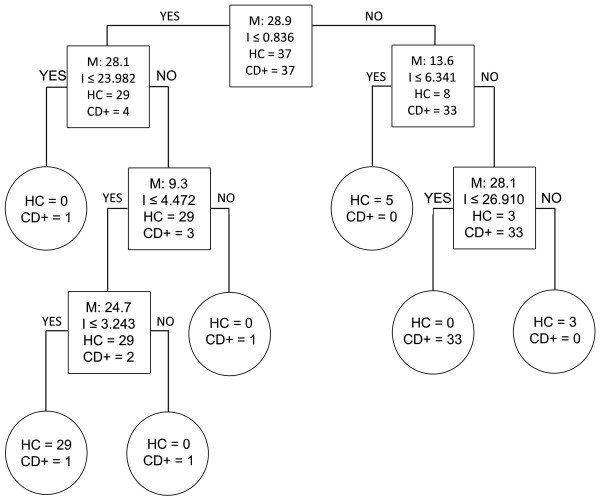
Biomarker patterns software based on CART analysis used to generate candidate diagnostic algorithms between the HC and 2008-CD + groups. Biomarker patterns software based on CART (Classification and Regression Tree) analysis was used to generate candidate diagnostic algorithms. Decision tree classifications using healthy controls (HC) vs 2008 chagasic samples (CD+) are shown. Biomarkers establishing the splitting rules are 9.3, 13.6, 24.7, 28.1, 28.9 kDa. Cases that follow the rule are placed in the left daughter node (YES), and samples that do not follow the rule are placed in the right daughter node (NO).