
Fig. 2.
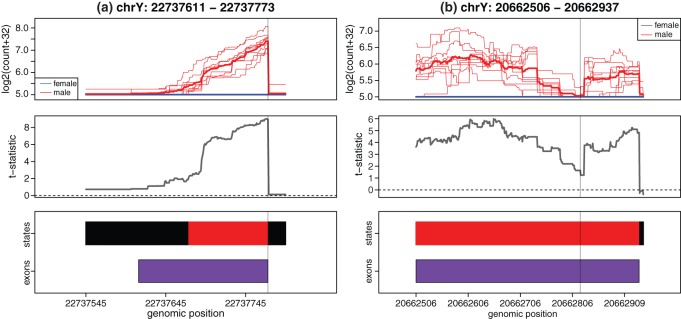
Cases where DER Finder correctly calls differential expression and annotate-then-identify methods do not. (a) Example of an exon (from gene EIF1AY, Ensembl exon id ENSE00001435537) whose location appears to be mis-annotated, leading EdgeR and DESeq to underestimate the exon's abundance and therefore incorrectly call this exon not differentially expressed. (b) Example of a DER ( ) falling outside of an annotated exon, which can be found by DER Finder but not by EdgeR or DESeq. Although there are no annotated exons in this region, we believe this finding is more than noise because it is supported by the following annotated ESTs: DR001278, BF693629, BF672674, BM683941, BM931807, and CD356860 (GenBank accession numbers. Top panels: single-base resolution coverage (on log2 scale). Middle panels:
  -statistics from linear model fit by DER Finder. Bottom panels: exon locations and state calls from DER Finder: light gray
  not expressed, black
  equally expressed, red or dark gray
  overexpressed in men).