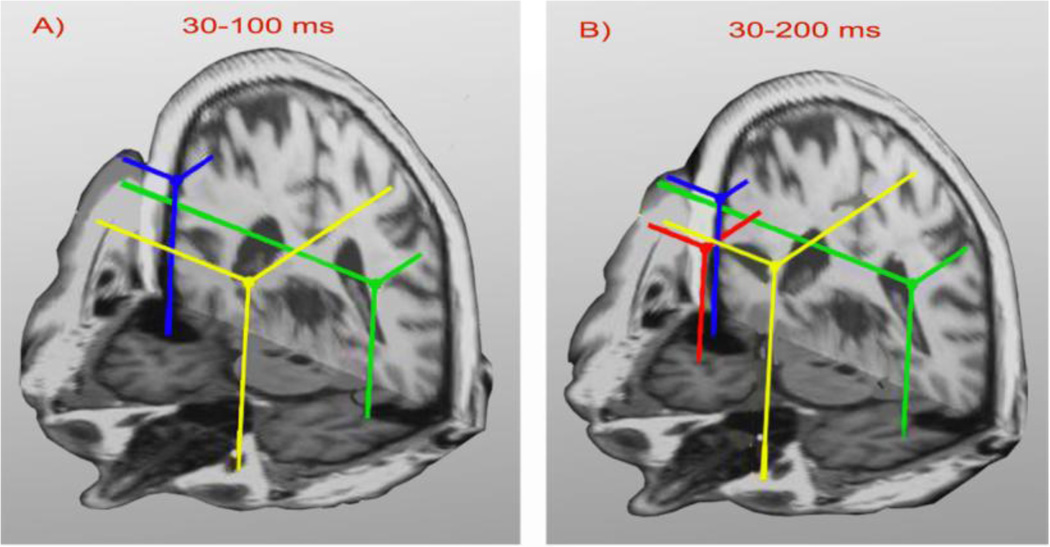
Fig. 2.
Ten best fitting source locations for each cortical location (bilateral STG and PF), obtained for 30–100 ms (panel A) and 30–200 ms (panel B) time windows, for the same subject are shown in an anterior axial-coronal 3-D view. Bilateral STG sources (green and blue dots) and a PF source (yellow dot) are evident in both the 3- and 4-dipole solutions across time intervals. An additional source (red) was evident in the 30–200 ms interval.

