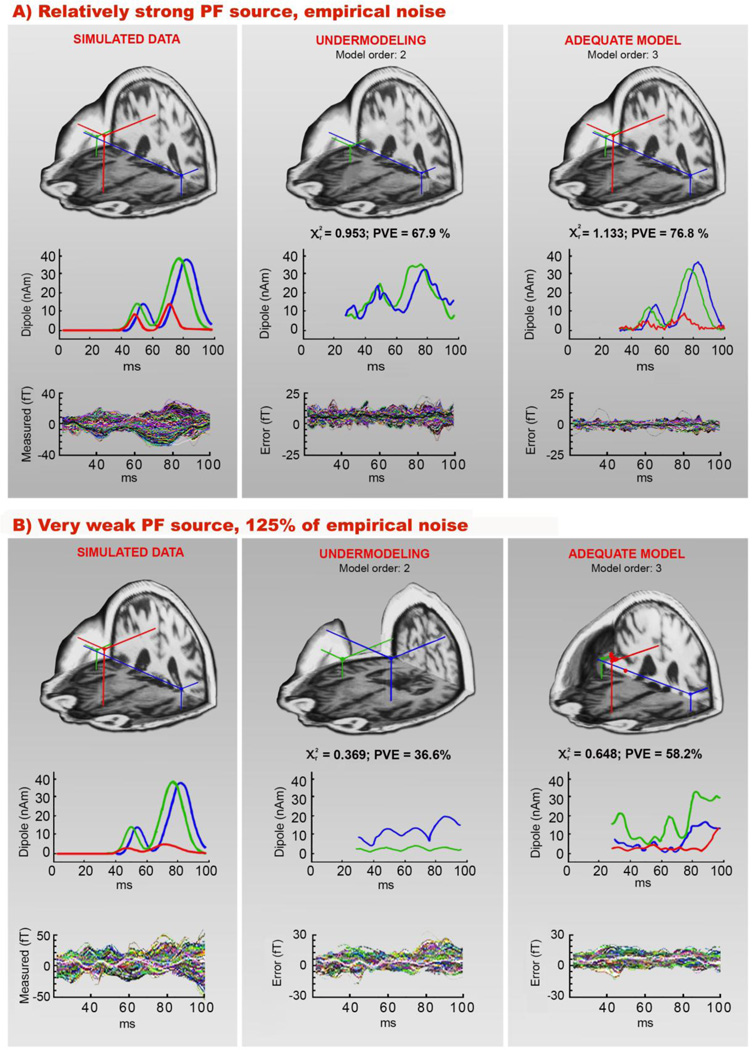
Fig. 4.
Numerical simulations showing the two extreme cases of PF source strengths. Simulated source configuration and modeling results are shown for M50 networks where PF activity was varied from being a relatively strong source (panel A) to a very weak source (panel B). The left column of (A) and (B) shows simulated source locations, along with their time courses, and their corresponding noisy simulated waveforms; empirical activity obtained from the pre-stimulus interval (−100 – 0 ms) was added to the waveforms (100% in panel A and 125% in panel B). Two strong bilateral sources were placed in the vicinity of the STG on the realistic cortical surface of subject S2 (at a depth of 0.9 cm) and the PF source was placed in the medial region of the frontal lobe at a depth of 3.24 cm. Modeling results assuming 2- and 3-dipole models (ten best-fitting location and time course estimates) and the residual (“error”) waveforms from all channels, are shown in the middle and the right columns. The extreme noise level and attenuation of PF source strength influenced the estimated time courses more than their spatial localization (right column of panel B).

