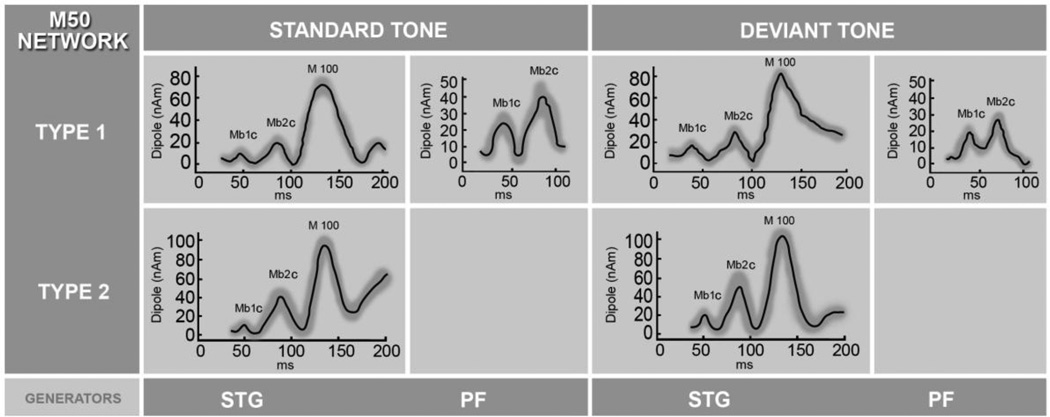
Fig. 5.
Estimated time courses of PF and STG sources underlying the M50 complex formation averaged across all subjects for the standard and deviant tones. In the elderly controls (network type 1) three generators of the M50 network were identified, bilateral STG and the PF source. In contrast, MCI/AD subjects (network type 2) showed no frontal activity. Time courses of the STG activity were averaged across subjects and hemispheres (standard deviations shown as a gray band), and displayed for the 30–200 ms time window to include M100, the most prominent STG response. The M100 is used for amplitude comparison with earlier cortical Mb1c and Mb2c components.

