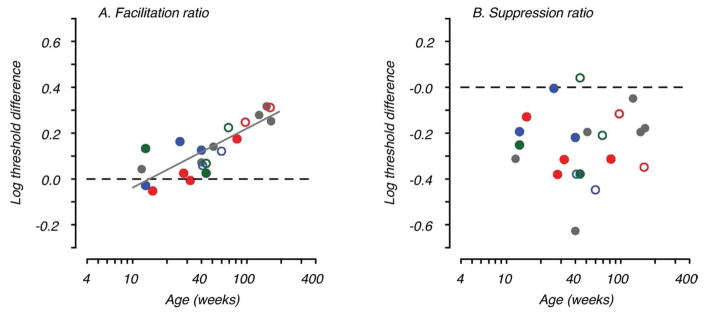
Figure 5.

Development of facilitation and suppression. A. Facilitation ratio (maximal threshold enhancement relative to baseline contrast threshold) is plotted as a function of age in weeks. The solid line is the fitted regression showing the increase in facilitation with age. B. Suppression ratio (threshold elevation by nearby flankers relative to baseline contrast threshold) is plotted as a function of age. Regression analysis showed no significant change in suppression with age. The gray filled symbols represent data from animals tested fewer than four times. The colored symbols show data from individual animals tested more than four times; open symbols indicate data collected at 125cm for these animals. Note that two of the longitudinal animals illustrated were tested at both viewing distances at the same age (blue & green open and filled symbols ~40wks). Blue data points are for the animal illustrated in Fig. 4.
