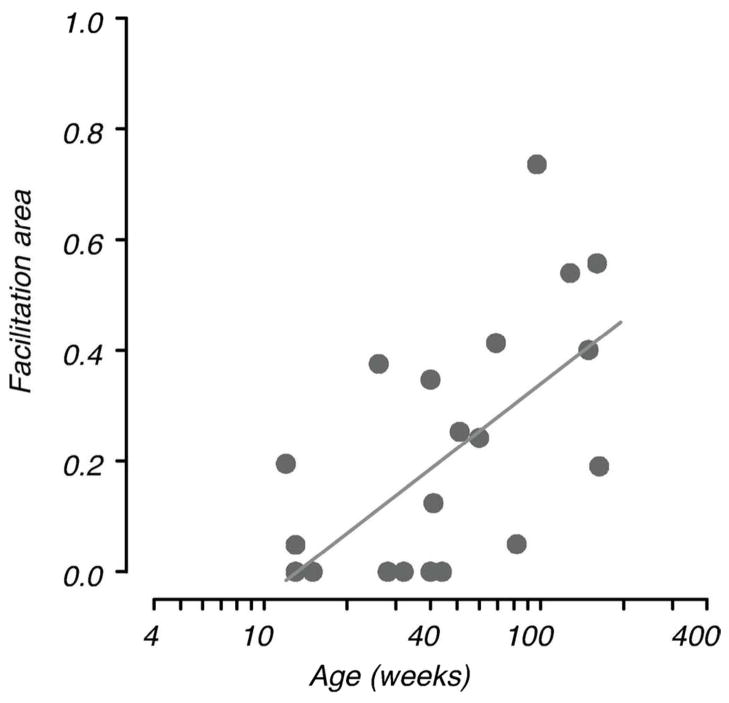
Figure 6.
Range of facilitation. Facilitation area is plotted as a function of age. This measure, derived from the DoG fits, takes account of the spatial extent of facilitation as well as the amplitude of facilitation (see Fig. 2). The solid line is the fitted regression showing the increase in facilitation with age.

