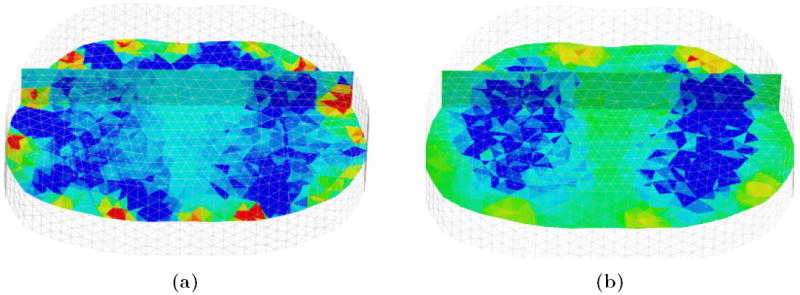
Figure 4.

Reconstructions in 3D rendered in MayaVi software (Ramachandran (2001)); (a) and (b) are conductivity changes at max inhalation for a standard and shape corrected reconstruction respectively. The front of the chest is in the background, and transverse and coronal scalar-cut planes are shown within the 3D volume.
