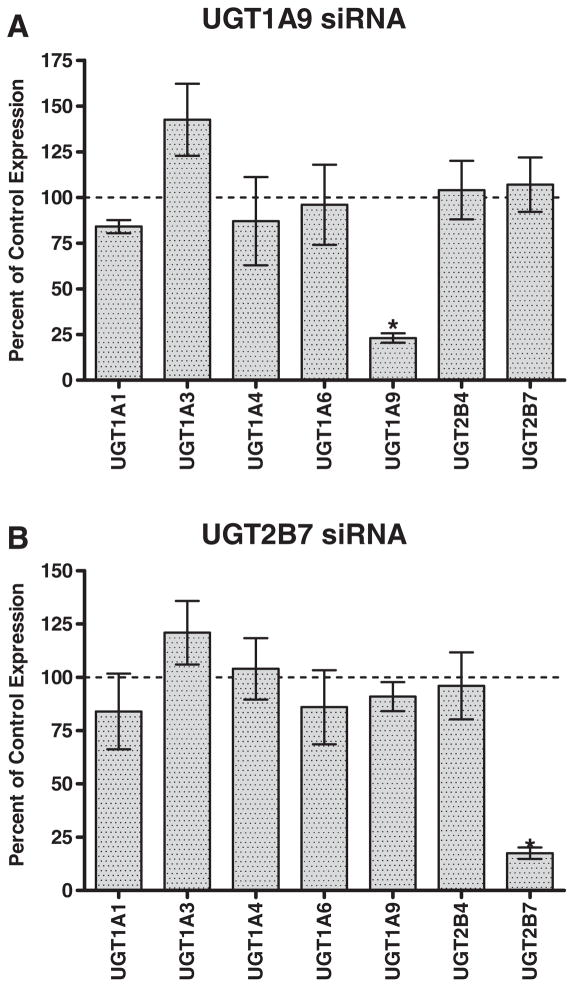
Fig. 2.
siRNA down regulation of UGT1A9 and UGT2B7 in human hepatocytes. Quantitative PCR analysis data for transfection with (a) UGT1A9 or (b) UGT2B7 siRNA indicates selective down regulation of the intended target gene. Control data (100% of control expression) defines the expression of each respective mRNA in the absence of siRNA treatment and after normalization to the 18S1 control. An asterisk (*) indicates a statistically significant difference, where p < 0.0001. Error bars indicate the standard deviation for replicate incubations (n = 3).

