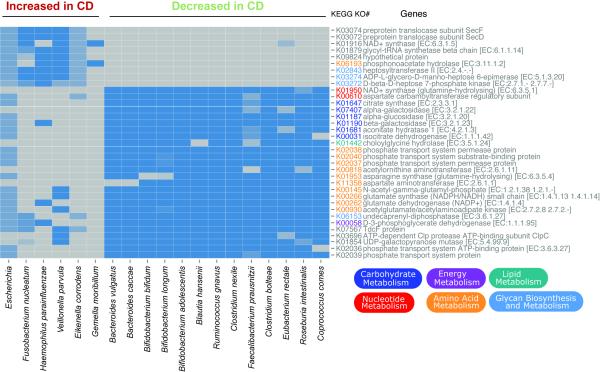
Figure 3. Comparative genomics of CD biomarkers.
The KEGG metabolic pathways that differentiate the species by behavior in disease state are shown as a heatmap. A selection of reference genomes that are representative for the species increased or decreased with disease were obtained from IMG (JGI), and biomarker detection was performed on their gene content at the level of KEGG pathways. Several were statistically significant (Wilcoxon, p < 10e-8) and are visualized here. Related to Table S2.

