
Figure 6. In vivo Ca2+ imaging of neuronal activity in the motor cortex with Thy1-GCaMP3 transgenic mice.
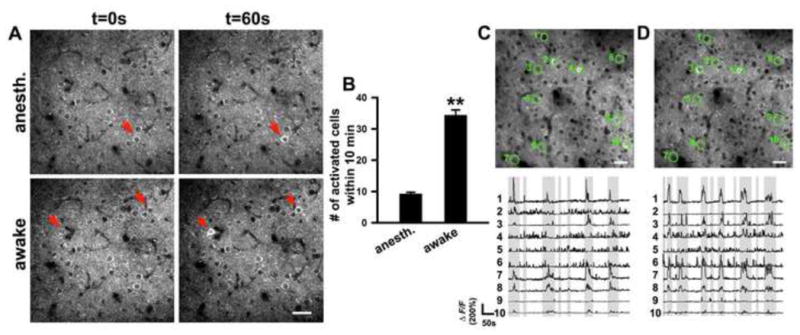
(A, B) In vivo two-photon time-lapse images of layer II/III neurons in the motor cortex of 5-month-old Thy1-GCaMP3 mice. Top panel shows an example of neuronal activity in the anesthetized state. Bottom panel shows neuronal activity in the awake state. Red arrows mark activated neurons. Quantification of the number of activated neurons within 10 min in anesthetized (n = 5 areas from 3 mice) and awake state (n = 4 areas from 3 mice) is shown in B. Data are presented as mean ± SEM. **p<0.005.
(C–D) Repeated imaging of calcium dynamics of layer II/III neurons in the motor cortex. (C) A raw fluorescence image of layer II/III neurons in the motor cortex of Thy1-GCaMP3 mice at 7 days after surgery (top) and ΔF/F traces of each circled neuron (bottom). Shaded part of the traces indicates that the mice were moving. (D) The fluorescence image of the same field and fluorescent traces of the same neurons as in (C) at 22 d after surgery. Scale bar, 50 μm for (A, C and D).