
Figure 7. In vivo imaging of sensory stimulation-evoked calcium transients in the somatosensory cortex of Thy1-GCaMP3 transgenic mice.
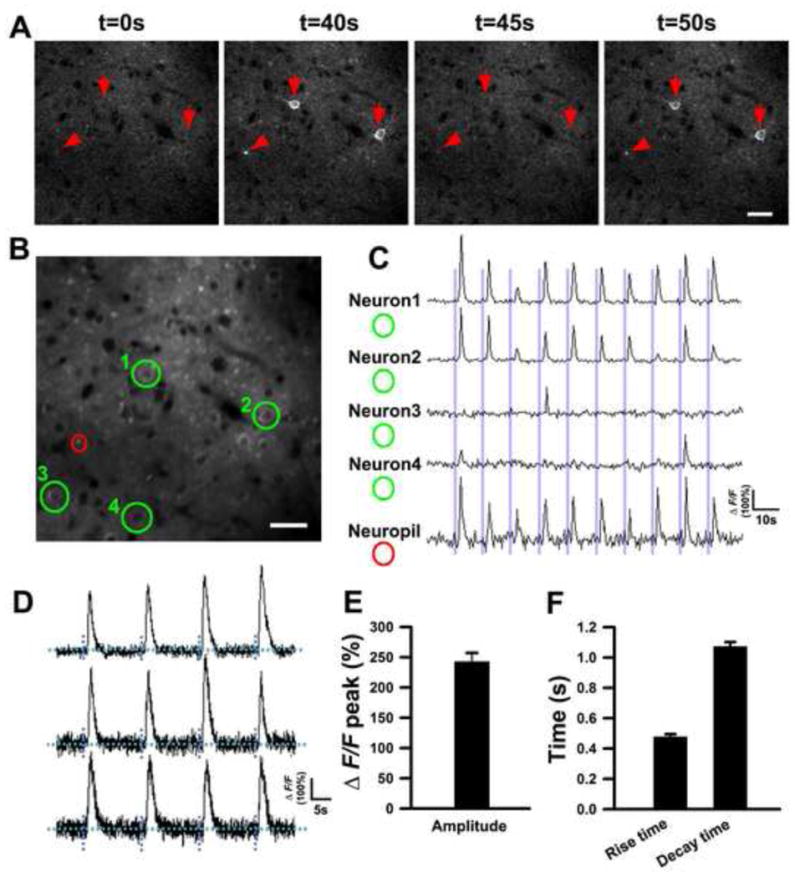
(A) In vivo two-photon time-lapse images of layer II/III neurons in the somatosensory cortex of Thy1-GCaMP3 mice. Red arrows mark activated neurons and a red arrowhead marks an activated neuronal process.
(B, C) Calcium dynamics of layer II/III neurons in the somatosensory cortex. (B) shows a raw fluorescence image of layer II/III neurons. Fluorescence traces of the neurons (green circles) and neuropil (a red circle) are shown in (C). See also Movie S8.
(D) Three examples of individual fluorescence traces of layer II/III neurons in the somatosensory cortex using 40 Hz scanning speed.
(E) The average maximal fluorescence changes.
(F) Decay time and rise time of neurons responses to a single air puff.
Data are mean ± SEM. (n = 8 cells from 3 mice for E and F). Scale bars, 50 μm for (A) and (B).