
Fig. 5.
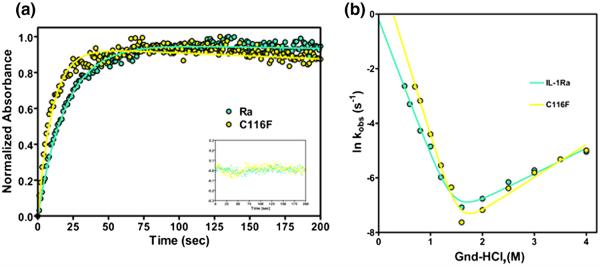
Representative traces of the folding kinetics and chevron plot of the relaxation rates indicating the effects of altered chain connectivity. (a) WT IL-1Ra is in cyan and C116F is in yellow. The traces are of the manual mixing kinetic refolding jumps from 2.2 M guanidine–HCl to 0.4 M guanidine–HCl. The residuals of the fit, following the same coloring scheme, are represented in the inset. (b) Plot of the natural log of kobs obtained by both stopped-flow and manual-mixing refolding and unfolding experiments for both protein variants as a function of final denaturant concentration. The data points (left and right, circles) and fits depict the rate of formation of the native protein.