
Figure 5.
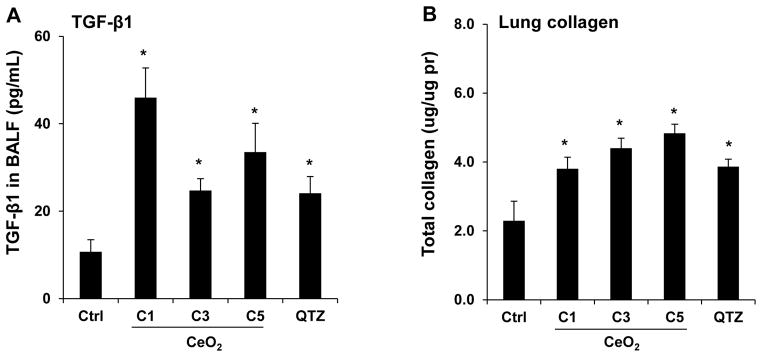

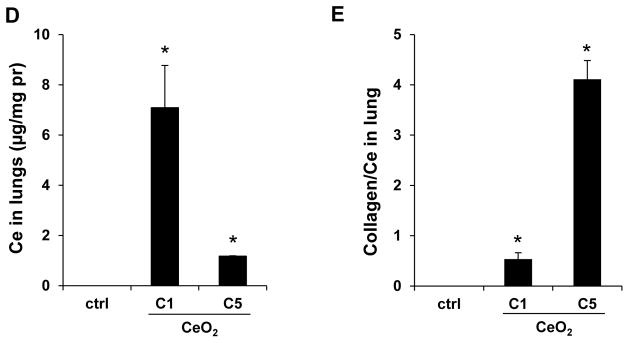
Sub-chronic pulmonary effects of CeO2 nanoparticles at 44 days. (A) TGF-β1 levels in BALF and (B) total collagen content of the lungs of mice receiving 4 mg/Kg CeO2 nanoparticles. The animals were sacrificed after 44 days and all lung tissues were collected to determine the total collagen as described in Figure 4. (C) Lung sectioning and staining with Masson’s trichrome. Areas of concentrated blue staining represents collagen deposition sites. QTZ at 5.0 mg/kg served as positive control. (D) ICP-OES analysis to determine elemental Ce content in the lungs of mice receiving the same dose of C1 and C5 nanoparticles, followed by sacrifice after 44 days. (E) Comparative analysis of the collagen content in the lung of C1 and C5 exposed mice after correction for Ce content. This was accomplished by normalizing the total collagen content to the total elemental Ce content and expressed as collagen/Ce in lung. * p < 0.05 compared to control.