
Figure 1. Heterogeneous response of Cm-resistant cells.
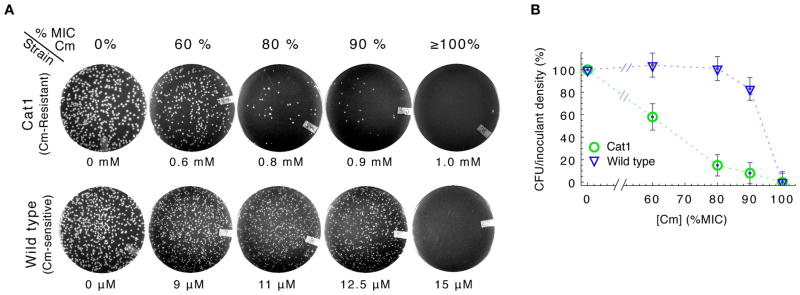
E. coli cells were diluted from log phase batch cultures lacking Cm, and were spread onto LB agar at densities of several hundred cells per plate before overnight incubation at 37°C. (A) Typical plate images of Cm-resistant Cat1 (top row) and Cm-sensitive wild type (bottom row) cells, with Cm concentration indicated below each plate and also given above as approximate fraction of the empirically determined MICplate for each strain (figs. S2A and S3A). (B) Percentage of viable cells grown on Cm-LB plates; CAT-expressing cells (Cat1, green) and wild type cells (EQ4, blue). Error bars estimate SD of CFU, assuming Poisson-distributed colony appearance.