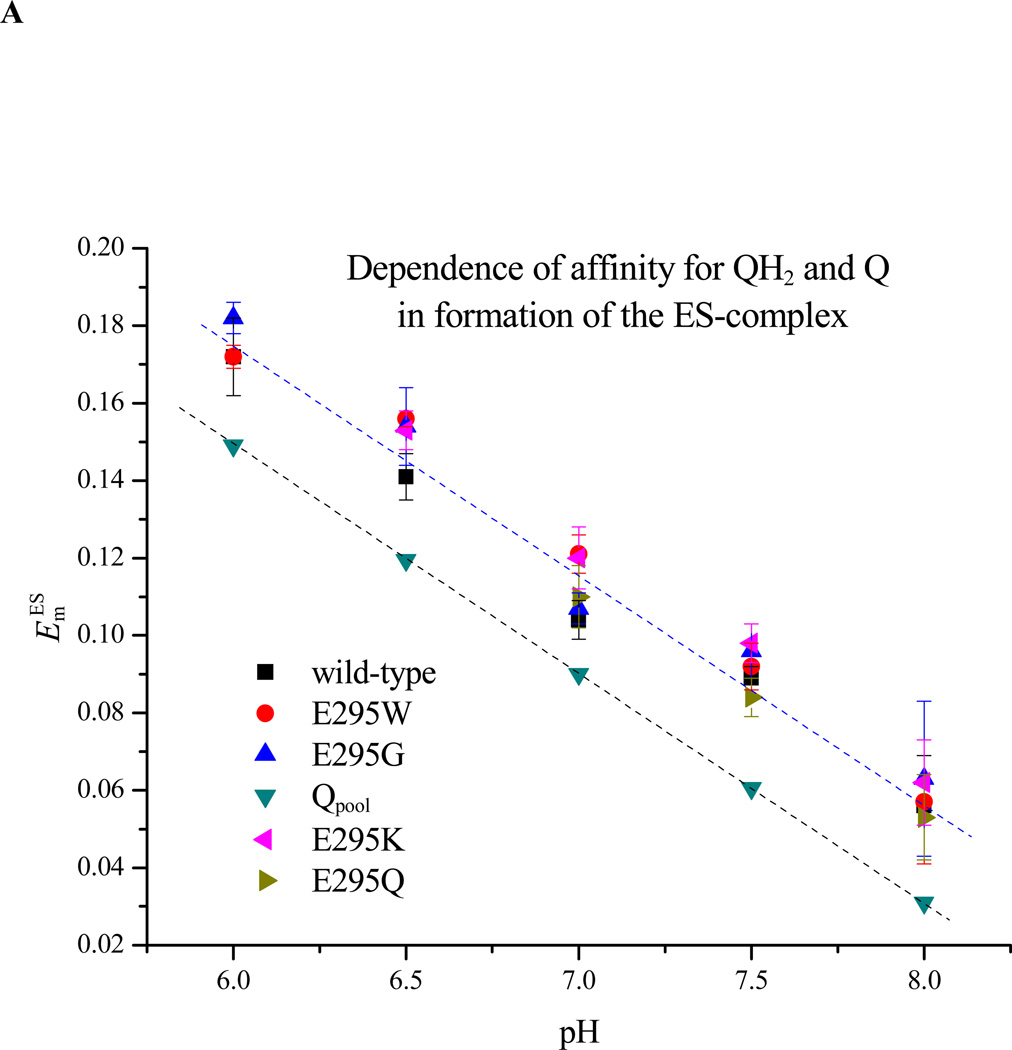
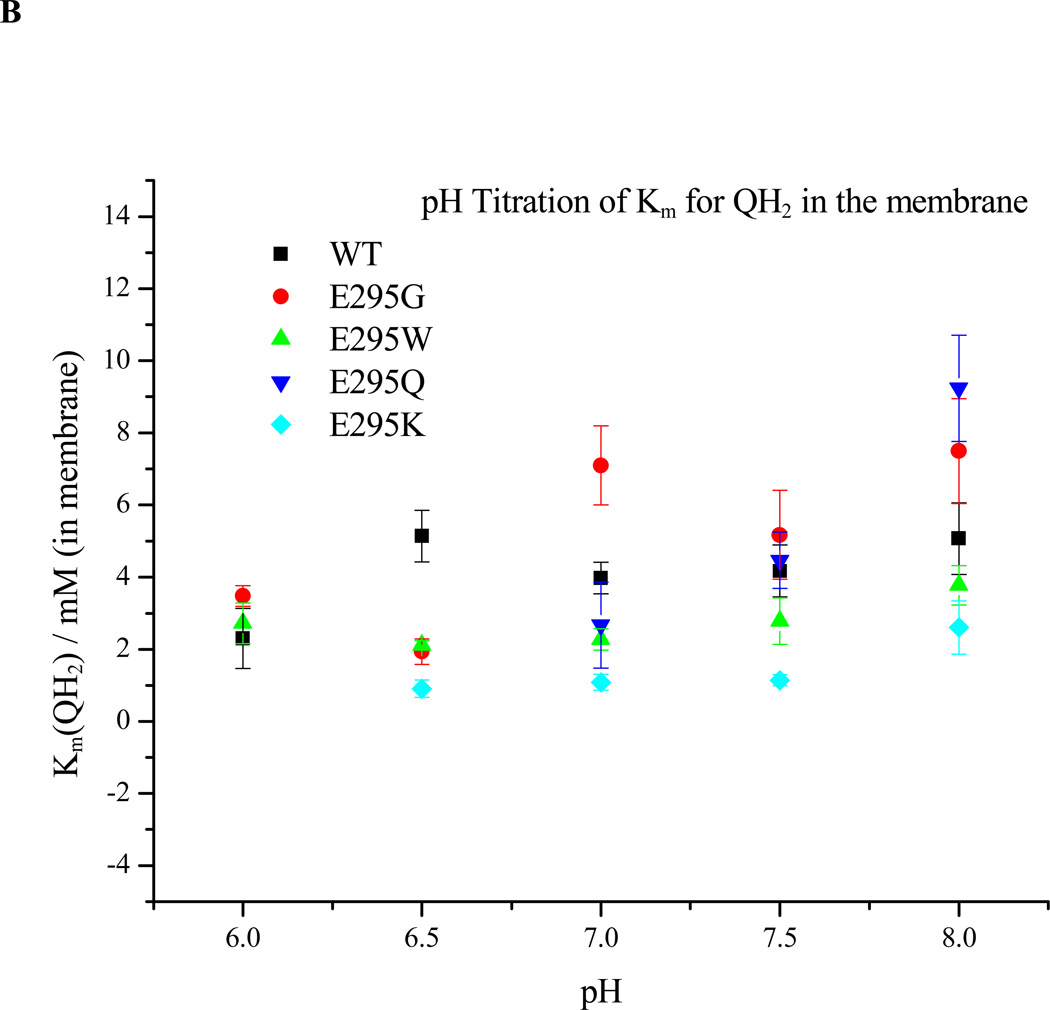
Figure 6. Dependence on pH of ES1-complex formation. A. Apparent Em for formation of the ES1-complex assayed from the dependence of rate on Eh.
The rate of QH2 oxidation, assayed through the rate of heme bH reduction in the presence of antimycin, was measured as the quinone pool was reduced by lowering the ambient redox potential, Eh. Since rate is proportional to [ES], the mid-point of the titration give Em ES. The Em values for wildtype and all mutants were displaced from that of the pool by ~30 mV, but all showed the same pH dependence. B. Dependence on pH of Km for QH2. The same data could be used to calculate Km values for QH2 for each strain tested, plotted here as a function of pH (see Materials and Methods section).


