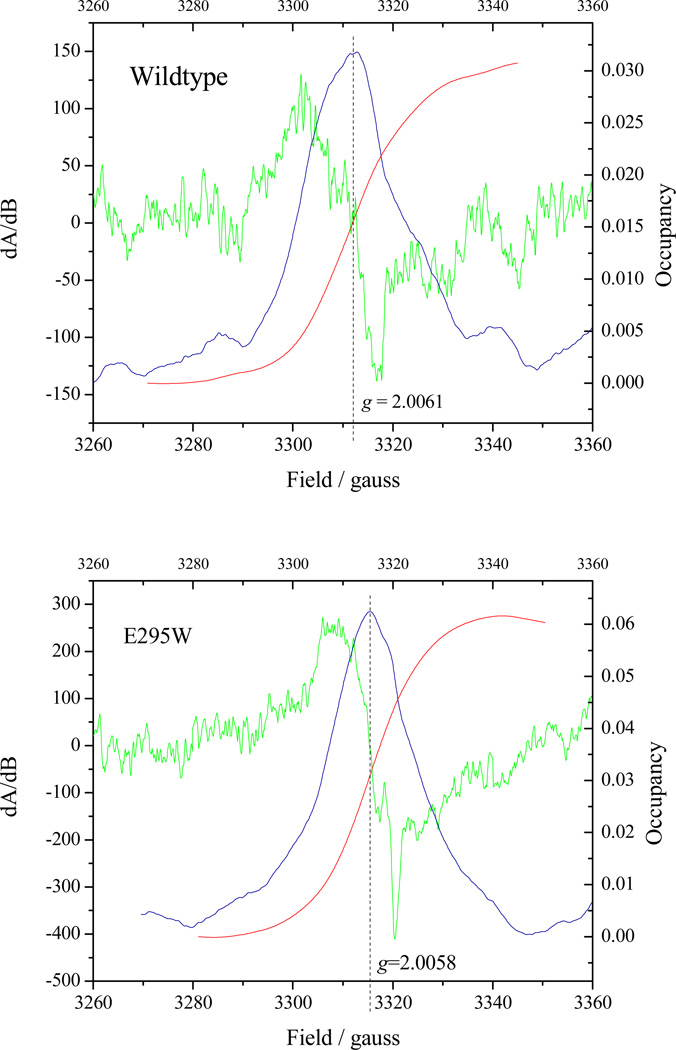
Figure 7. SQ occupancy at the Qo-site in wildtype and E295W mutant.
The green curve shows the CW-EPR derivative spectrum of the Qo-site SQ, obtained by subtraction of the signal when ascochlorin was added to the reaction mixture so as to remove components not associated with Qo-site turnover. The blue curve shows the result of a first integration (to generate the absorbance spectrum), and the red curve a second integration to determine the occupancy, shown by the right-hand scale. Antimycin was present in all experiments to eliminate contributions from the Qi-site SQ. See Materials and Methods section for details.

