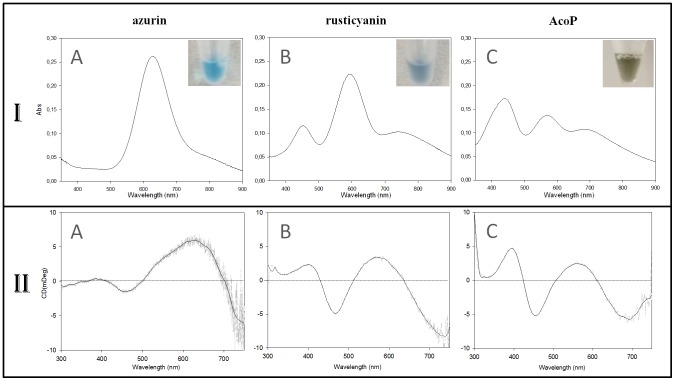
Figure 3. Spectroscopic properties of AcoP in comparison with well-known cupredoxins.
(I) UV-Vis and (II) CD spectra of (A) azurin, (B) rusticyanin and (C) AcoP. Both UV-Vis spectra and CD spectra were recorded at pH 5 in buffer B at room temperature. Insets in I: From left to right, color of around 1 mM of azurin (blue), rusticyanin (deep blue) and AcoP (dark green). Both crude data (light grey) and smooth data (dark line) are reported for CD experiment (II). Results presented have been derived from experiments repeated at least three times.

