
Figure 7. Determination of AcoP redox potential.
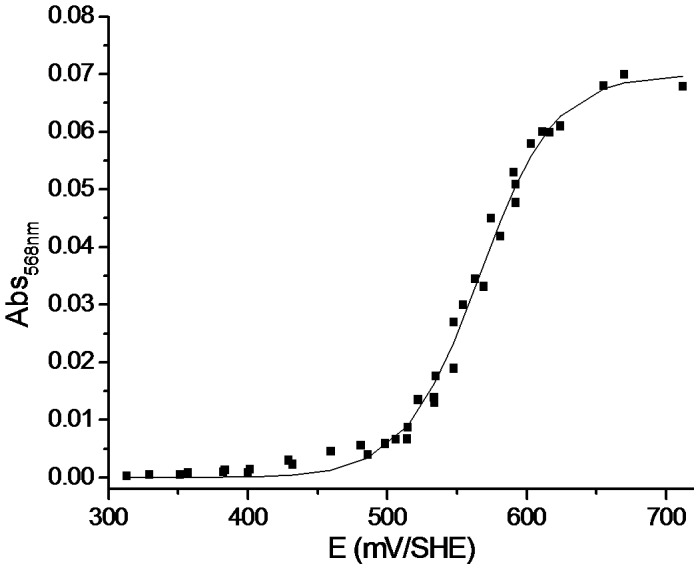
Redox titration of AcoP at pH(K2IrCl6) or reductant (C6H7NaO6) were used to oxidize or reduce the sample. The absorbance at 568 nm was plotted versus the redox potential of the solution. AcoP reduced spectrum was used to normalized the datas.