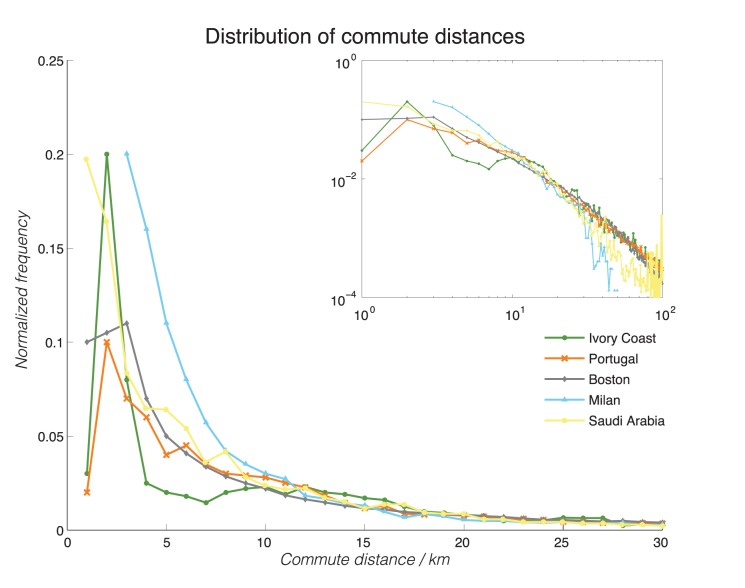
Figure 2. Distributions of home-work commuting distances, aggregated by countries/cities.
The distributions are plotted for Ivory Coast (blue solid line with closed dots), Portugal (red dashed line with x’s), Saudi Arabia (green solid line with open circles), Boston (black solid line with open diamonds), and Milan (cyan dashed line with open triangles). The inset plot is the same plot, reproduced on a log-log scale to show long-tail behaviors of the distributions. The same plots, as cumulative density functions, are shown in Figure S4 for comparative purposes.

