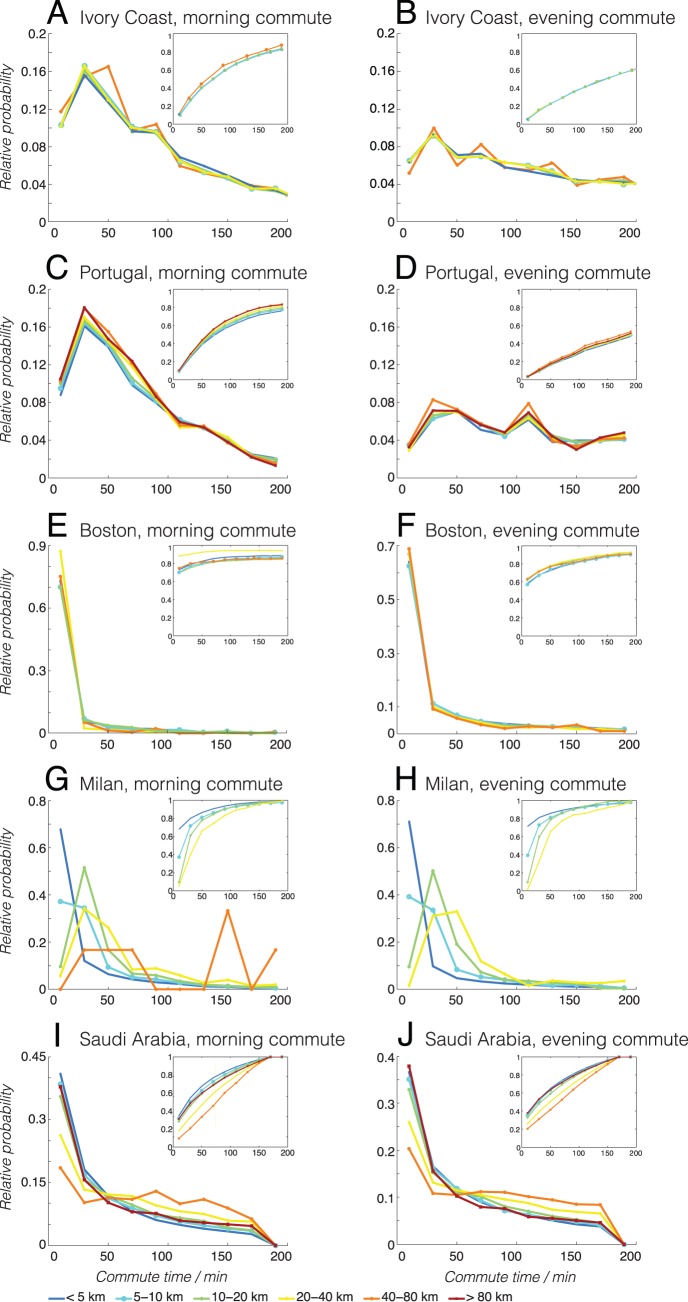
Figure 6. Probability density functions of commute times.
The first column of figures shows the probability density functions of morning commute times based on mobile phone signaling data, in Ivory Coast (a–b), Portugal (c–d), Saudi Arabia (e–f), Boston (g–h), and Milan (i–j), for individuals binned by their commute distances: <5 km (blue solid line), 5–10 km (red dashed line), 10–20 km (green dash-dotted line), 20–40 km (black solid line), and 40–80 km (magenta dashed line). The inset plots show the cumulative distribution function of the same quantities. The second column of figures shows the probability density functions of evening commute times the respective regions.

