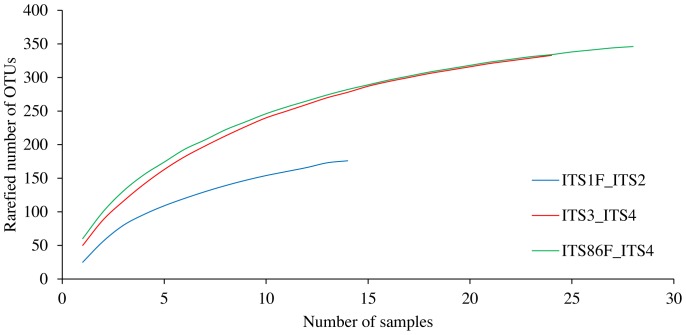
Figure 1. Rarefaction curves for each of the three primer pairs used in this study: ITS1F/ITS2, ITS3/ITS4 and ITS86F/ITS4.
In these graphs, the number of samples is plotted against the rarefied number of operational taxonomic units (OTUs) that were created based on a 97% sequence similarity cut-off value.

