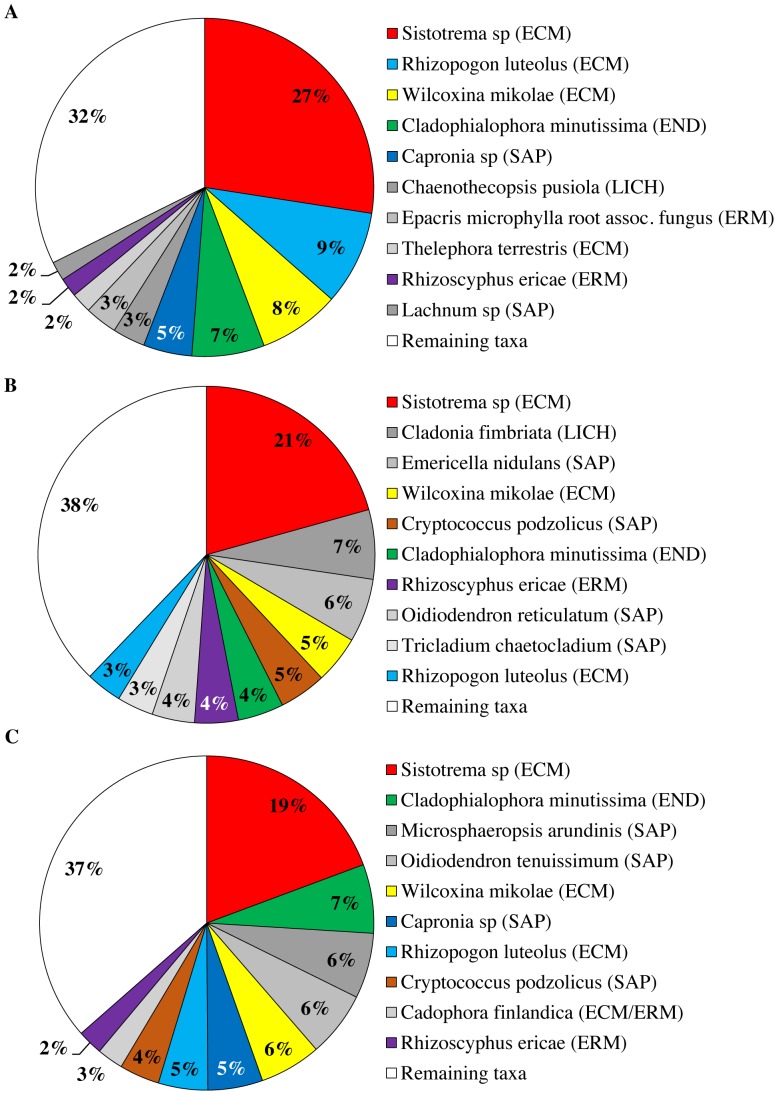
Figure 3. Relative abundance for the top ten most abundant species-level operational taxonomic units (OTUs), based on a 97% sequence similarity cut-off value, obtained for each of the three primer pairs studied (ITS1F/ITS2, ITS3/ITS4 and ITS86F/ITS4).
Reads that did not result in a BLAST hit against the UNITE or INSD databases were indicated as “not applicable (NA)”. Ecological functions of OTUs are indicated between brackets behind the OTU identities (ECM: ectomycorrhizal, ERM: ericoid mycorrhizal, SAP: saprotrophic, LICH: lichenized, END: endophytic). OTUs not belonging to the top ten most abundant OTUs were pooled in the category “Remaining taxa”. OTUs that appear exclusively in a single chart are indicated in grayscale. OTUs that can be found in multiple pie charts are indicated in colour. OTU abundance scores were averaged across replicates (four) and samples (seven). A. ITS1F/ITS2. B. ITS3/ITS4. C. ITS86F/ITS4.

