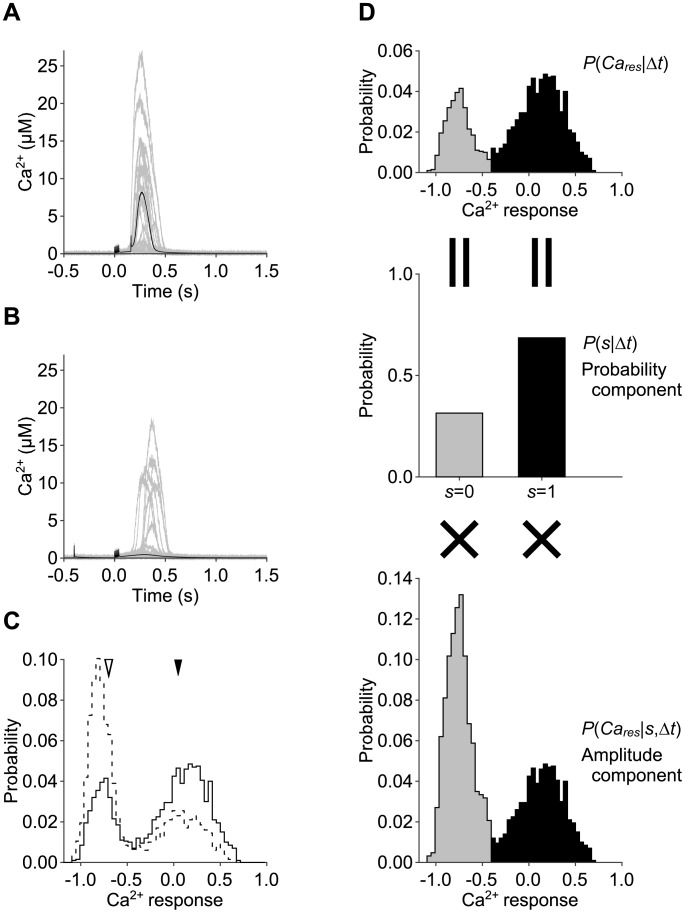
Figure 2. Ca2+ increases in the stochastic model.
A, B, Ca2+ increase due to stimulation of PF and CF inputs with Δt = 160 msec (A) and Δt = −400 msec (B) in the stochastic model in a spine volume (gray lines, n = 2,000 for each timing, 20 examples are shown) and in a cell volume (black lines, n = 20 for each timing). C, Distributions of the Ca2+ response in a spine volume with Δt = 160 msec (solid line) and Δt = −400 msec (dashed line). Black and white arrowheads indicate the means of the Ca2+ response in a cell volume with Δt = 160 msec and Δt = −400 msec, respectively. Note that Ca2+ increases in a cell volume were almost the same between trials, leading to the overlap of the time courses (A, B). D, The distribution of the Ca2+ response (upper panel) was divided into the distribution with Ca2+ spikes (s = 1, black) and the distribution without Ca2+ spikes (s = 0, gray with dashed line). Then, each right (s = 1) and left (s = 0) distribution is decomposed into the probability components, which is probability of Ca2+ spiking (middle panel), and amplitude components, which is distribution of the Ca2+ response conditioned by Ca2+ spiking (lower panel). See materials and methods for the detailed descriptions.

