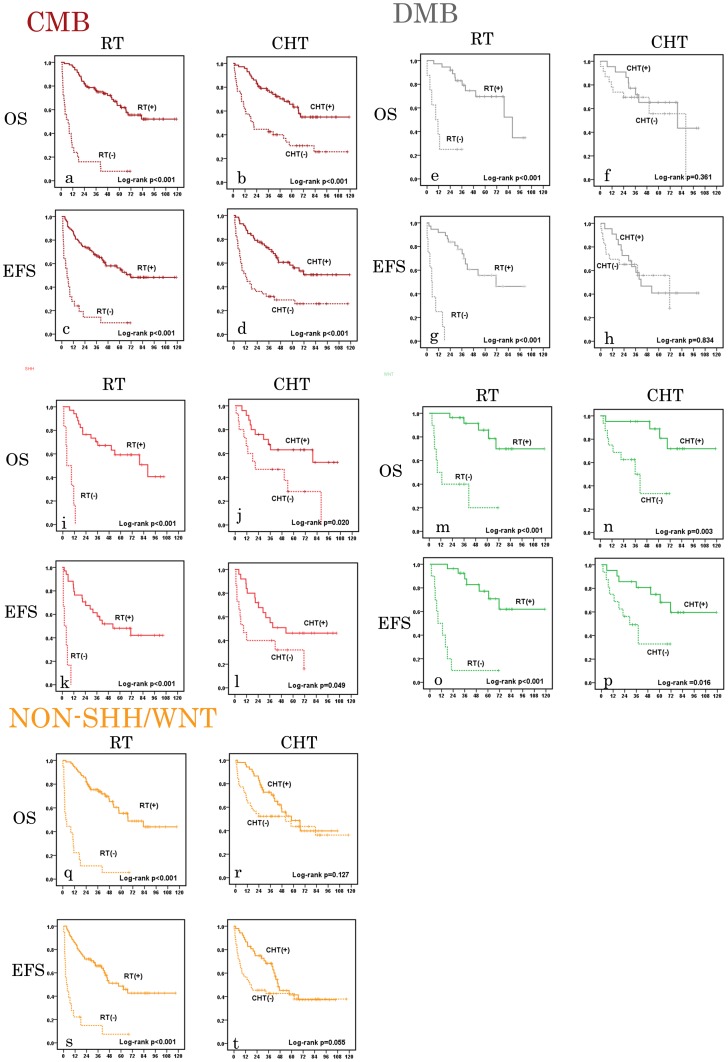
Figure 2. Univariate analysis of overall survival (OS) and event-free survival (EFS) of histological and molecular subgroups of medulloblastoma.
a–d: OS and EFS analysis in classic medulloblastoma (CMB, dark red) according to postoperative radiation therapy (RT) and chemotherapy (CHT). e–h: OS and EFS analysis in desmoplastic/nodular medulloblastoma (DMB, grey) according to postoperative RT and CHT. i–l: OS and EFS analysis in SHH medulloblastoma (red) according to postoperative RT and CHT. m–p: OS and EFS analysis in WNT medulloblastoma (green) according to postoperative RT and CHT. q–t: OS and EFS analysis in Non-SHH/WNT medulloblastoma (yellow) according to postoperative RT and CHT. Numbers on the Y axis indicate probability of survival in medulloblastoma patients. Numbers of the X axis indicate the follow-up time (months).

