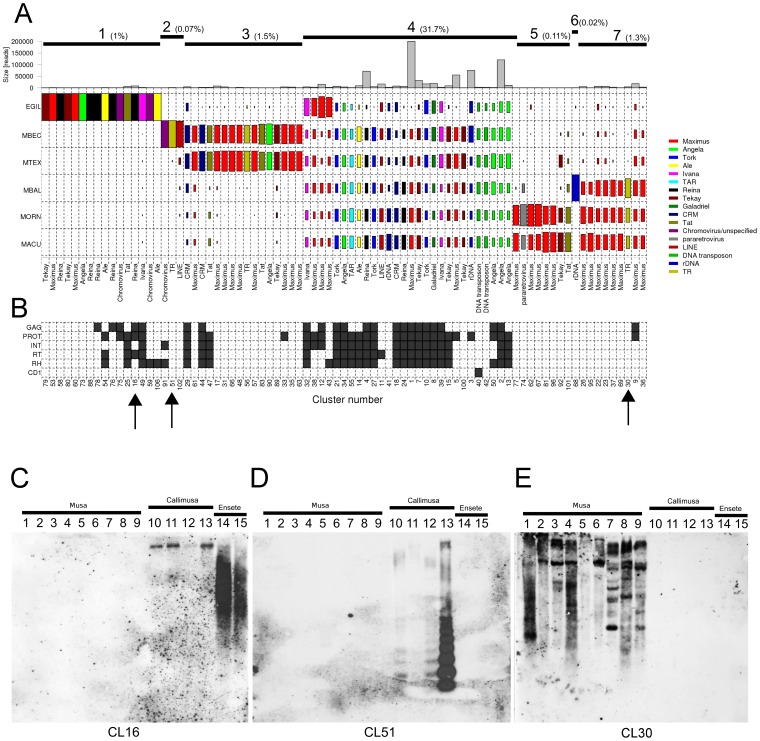
Figure 4. Comparative analysis of Musaceae species based on the cluster composition.
(A) Sequence composition of the largest clusters is shown. The size of the rectangle is proportional to the number of reads in a cluster for each species. Bar plot in the top row shows the size of the clusters as number of reads. Color of the rectangles correspond to the type of the repeat. Upper lines label groups of clusters discussed in the text. The percentage of reads included in the group is shown in parentheses. (B) The presence of mobile element protein domains in the contig assembled from sequences within the cluster. Only clusters that were annotated are shown. (C–E) Validation of clustering results by Southern blot. Genomic DNA from 15 species was probed with sequences derived from clusters CL16, CL51. and CL30. The lanes contain DNA from 1/M. acuminata ssp. zebrina (ITC 0728), 2/M. acuminata ssp. malaccensis (ITC 0250), 3/M. acuminata ssp. burmannicoides (ITC 0249), 4/M. ornata (ITC 0637), 5/M. mannii (ITC 1411), 6/M. ornata (ITC 0528), 7/M. balbisiana (ITC 1120), 8/M. balbisiana (‘Pisang Klutuk Wulung’), 9/M. balbisiana (ITC 0247), 10/M. peekelii (ITC 0917), 11/M. maclayi (ITC 0614), 12/M. textilis (ITC 0539), 13/M. beccarii (ITC 1070), 14/E. ventricosum (ITC 1387), and 15/E. gilletii (ITC 1389).

