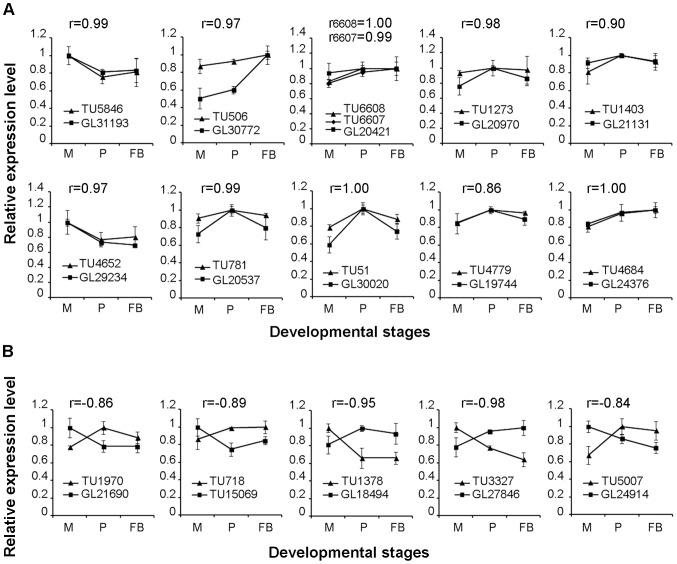
Figure 5. Expression profiles of lincRNAs/apcGenes across the three developmental stages.
(A) Expression profiles and Pearson correlation coefficients for lincRNA/apcGene showing positive correlation. (B) Expression profiles and Pearson correlation coefficients for lincRNA/apcGene showing negative correlation. The X axis shows the developmental stages. The Y axis shows the relative expression level, which has been normalized to the highest abundance levels across the three stages. Error bars denote the standard deviations of the three qPCR replicates. M: mycelia; P: primordia; and FB: fruiting bodies; r: Pearson correlation coefficient.

