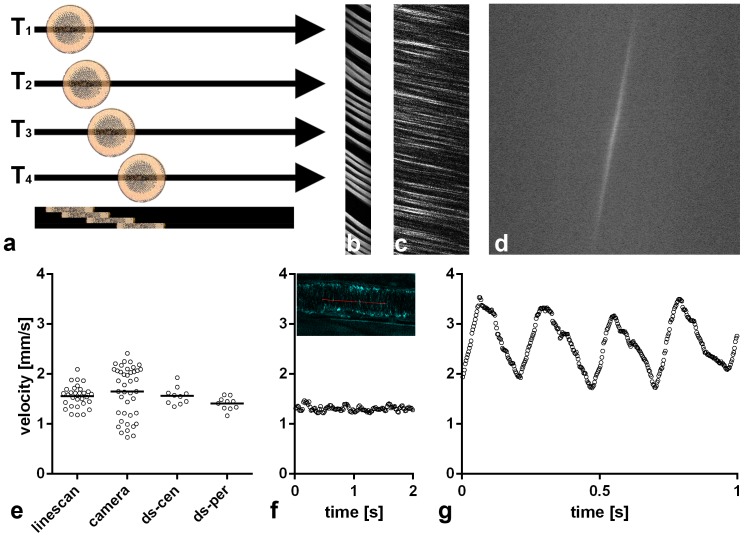
Figure 2. THG line scanning in the mouse cremaster muscle.
(a) Scheme of the process. Erythrocytes passing by cause a signal in each of the four sequentially scanned lines, recorded at time points T1 to T4. Lines are put together in an x-t-representation (bottom). Here, each erythrocyte moving along the scanned line shows a continuously advancing position, resulting in a streak of signal with a measurable angle. The orientation of the individual lines is the same in all following x-t-representations. (b) x-t-representation from a capillary, (c–f): Comparison of various evaluations on the same 30 µm cremaster venule. (c) x-t-representation. (d) Fourier-transformation of the x-t-representation which is partly shown in c. The calculated average velocity in this example was 1.5 mm/s. (e) Comparison of velocities measured with THG line scan visualized in C (1.56 mm/s±0.22 s.d.) and with fluorescent beads and a camera (1.65 mm/s±0.50 s.d., Figure S1) in the same venule. Horizontal lines indicate mean values. Double line scans (ds) scanned two parallel lines alternately, with ds-cen more centrally (1.56 mm/s±0.17) and ds-per more peripherally (1.41 mm/s±0.12). Note higher velocity in ds-cen (p = 0.037, t-test). (f) LS-PIV measurements with the line scanning data set visualized in C. Two of seven seconds continuous run are shown with a data point every 16 ms. Average speed was 1.3 mm/s±0.07 s.d. The inset shows the position of the scan line (red) in this venule, visualized by THG. (g) LS-PIV measurements at the center of a 50 µm arteriole from the same cremaster muscle with a data point every 3 ms. Mean velocity over 11.9 seconds (19895 data points) was 2.35 mm/s, heart rate was ∼250 beats/min.

