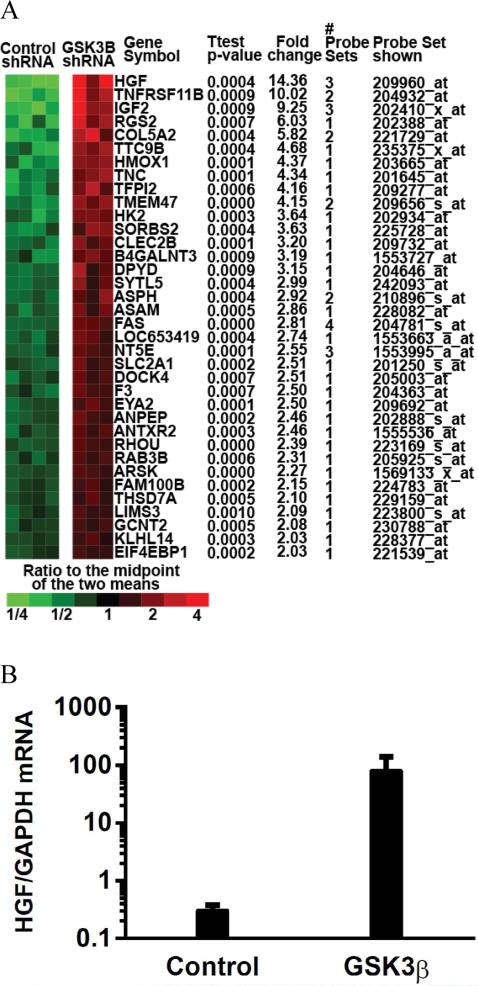
Figure 3.
Changes in gene expression in response to GSK3β silencing. A, Gene expression changes were determined in response to control or GSK3β shRNA in 3-4 Panc-1 tumors per treatment condition using an Affymetrix DNA microarray. Shown are distinct genes increased by an average of at least 2-fold relative to control shRNA with 2-sample t-test p-values of <0.001. The #probe sets indicate the number of probe sets used for each qualified gene. HGF was found to be the most up-regulated gene in response to GSK3β silencing. Microarray data, methods, and analysis have been deposited in the NCBI Gene Expression Omnibus [60] and are accessible through GEO Series accession number GSE35351 (http://www.ncbi.nlm.nih.gov/geo/query/acc.cgi?acc=GSE35351). B, Independent analyses using quantitative PCR confirmed increased HGF expression in response to GSK3β shRNA in Panc-1 cells. Data are the mean of n=2 ± SE independent experiments performed at least in duplicate..

