
Figure 2. PCoA plots of microbial community similarity in second experiment for unweighted analysis (A–C) and weighted analysis (D–F).
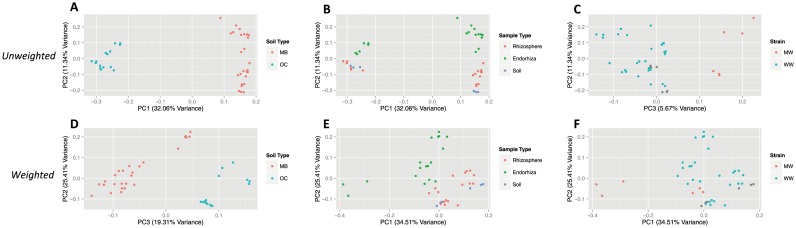
Plots for unweighted analysis are based on unweighted UniFrac distances, and demonstrate relationship between soil type (A), sample type (B), strain (C), and the major PC axes (PC 1 = 32.06% variance, PC 2 = 11.34% variance, PC 3 = 5.67% variance). Plots for weighted analysis are based on weighted UniFrac distances, and demonstrate relationship between soil type (D), sample type (E), strain (F), and the major PC axes (PC 1 = 34.51% variance, PC 2 = 25.41% variance, PC 3 = 19.31% variance). Note that PC 1 in the unweighted analysis is dominated by variation in soil type (A), but PC 1 in weighted analysis is dominated by strain (F). Grey points (Fig. 2c, 2f) represent bulk soil samples that aren't associated with either strain. Abbreviations for strains are denoted by MW (Mauie Wowie) and WW (White Widow), and abbreviations for soil type are denoted by MB (Mo-Bio soil) and OC (Orange County soil).