
Figure 6. Assessment of model fit for chickenpox data, treating 1967–76, 1977–97 and 1998–2008 separately.
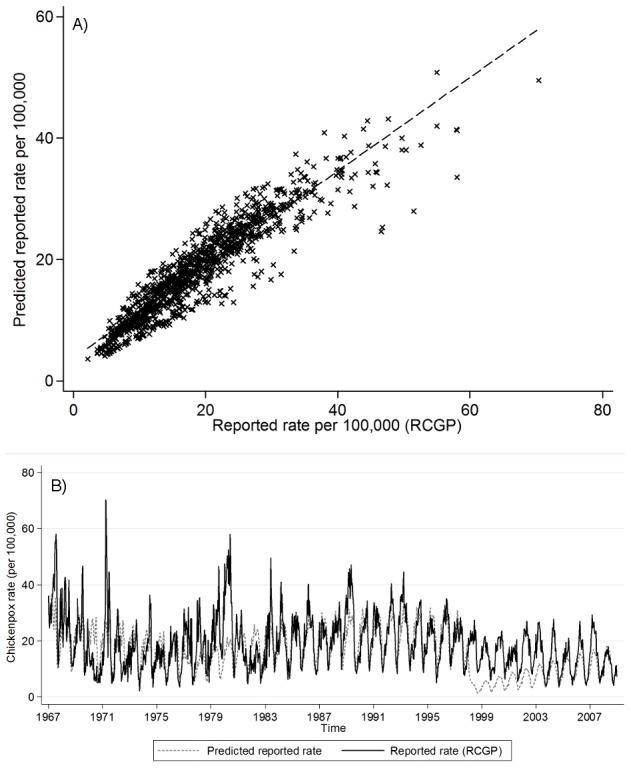
A) Relationship between the RCGP chickenpox consultation rates and the fitted values from the regression (scaled down for under-reporting); B) RCGP data and the values predicted by the difference equations using the estimated contact parameters.