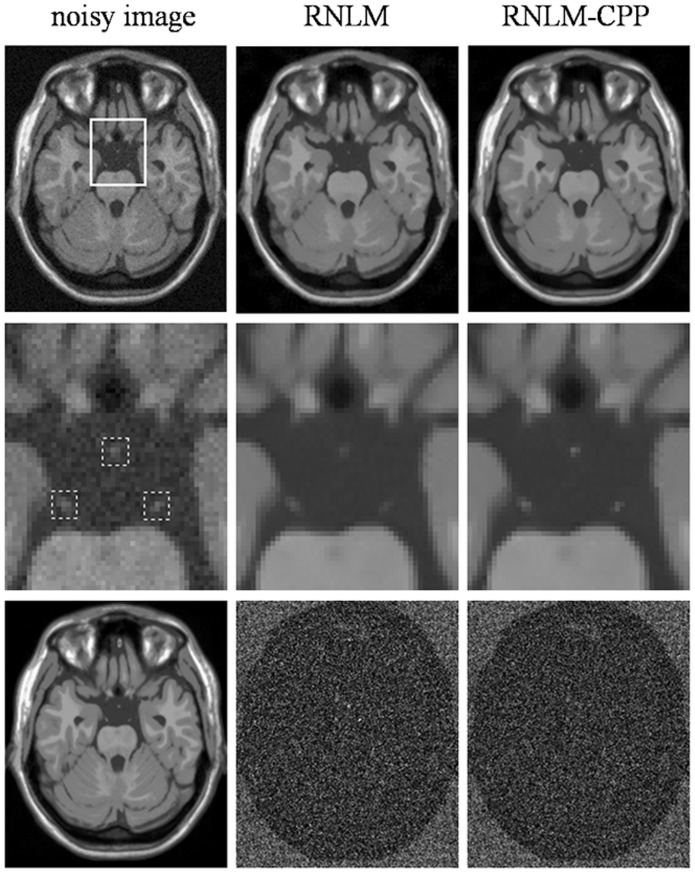
Figure 3. Comparison of RNLM and RNLM-CPP algorithms on denoising simulated T1w images.
Top row, from left to right: noisy image with 5% of Rician noise, denoised results with different algorithms. Second row, from left to right: zoomed part of the corresponding images in the top row, the dotted boxes indicate the local areas around manually-defined particles. Bottom row, from left to right: T1w noise-free image and corresponding image residuals.

