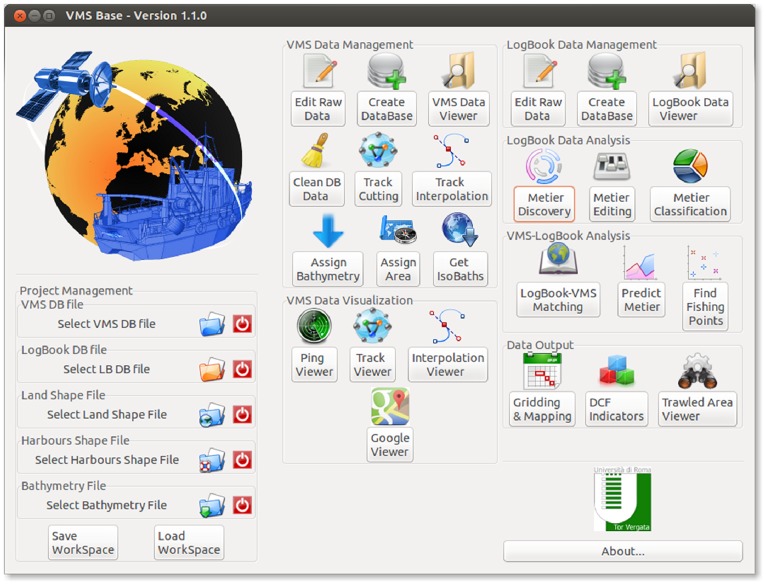
Figure 1. Main interface of the VMSbase package.
It is organized into groups of icons that allow access to different functions that operate on different input data (VMS, logbooks, or a combination of the two). The “Project Management” panel on the bottom left side allows setting the files for the work session (and also saving and loading the workspace). The “VMS Data Management” and “Logbook Data Management” provide access to functions and routines for the analysis of, respectively, VMS and Logbook data. These two flows converge in the analyses provided in the “VMS-Logbook Analysis” panel. Finally, the main graphical and numerical outputs can be produced by the tools in the “Data Output” panel at the bottom-right side of the main interface.

