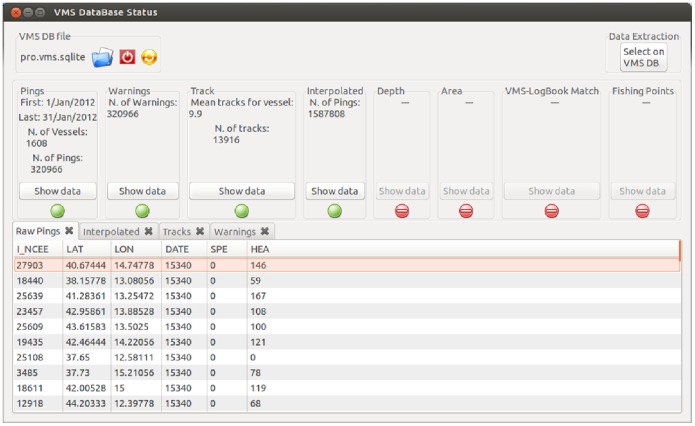
Figure 3. VMSbase interfaces for VMS data viewer or database query.
The upper area returns a series of statistical data for the selected database. A traffic light system is present to indicate the analyses already completed (green lights) and the ones which can still be performed (red lights). The bottom area shows the appearance of the dataset. Different panels are used for the native VMS pings, the Tracks (i.e. groups of VMS pings), the Interpolated tracks, the Warnings, etc. The names of the datasets as well as the data in the figure are just for the sake of illustration.

